After devising an asset allocation plan, many investors wonder if it is wiser to immediately pour all of their assets (which are most likely sitting in cash) into the funds within their plan (lump sum) or to split the investments across several months (dollar cost averaging). So, what method makes more sense for the majority of investors?
Simply put, if your goal is to maximize returns over the long-term, lump sum (LS) is the better course of action than dollar cost averaging (DCA) as it always has a higher expected return.
University of Chicago professor, Geoge Constantinides, supports this theory using complex mathematical and economics models in his paper, "A Note on the Suboptimality of Dollar-Cost Averaging as an Investment Policy," which can be found here. To break it down to the most simplistic premise, this conclusion makes perfect sense as it should seem obvious to any rationale observer that LS provides a higher likelihood of greater return than DCA because the market typically increases over time. That is, since one expects the market to have a positive return, getting in it sooner rather than later is always the best bet. Stated in another way, since the expected return of stocks and bonds is higher than that of money market funds and savings account, moving your assets immediately from asset classes with lower expected returns to higher ones will always increase your expected returns. However, there is certainly no guarantee that this will play out in all situations and your actual returns may vary. Thus, there is an important psychology at play when investors choose between using LS or DCA. Another study concluded that LS beats DCA about 65% of the time - this number is not surprising since the stock market increases about 65% of the time.
Another argument for LS investing is that if you have set up an asset allocation plan of stocks/bonds that matches your risk profile and time horizon, why not follow it immediately? If you decide that a 70% stock/30% bond mix is best for you and currently have $50,000 sitting in a savings/checking account, many would argue that you should implement the plan right away as it matches your directives. Why would you want a 20% stock/10% bond/70% cash allocation for a quarter of the year (assuming you're DCA four times over the course of a year)? If 70/30 makes sense for you in the long-term, then it makes sense now. If you can't stomach the up's and down's that portfolio can sustain, then perhaps it's not appropriate for you. These points certainly have merit and from a mathematical and statistic standpoint, LS is the way to go.
Having provided ample documentation that LS investing provides the higher expected performance over the long-term, I still don't want to make a blanket statement that everybody should utilize the LS strategy; and that is because of psychological factors and risk. If you are a new investor that seeks to enter the stock market, but are a bit timid about the prospects of such a volatile asset class, then I think DCA is a good method. Additionally, spreading out your investments over time certainly does reduce risk (although with a lower expected return). There is no way to time the market and it is expected to increase in value over time, but spreading your investments into an index fund over the course of a year or so might make sense if it allows you to "stay the course" (i.e. not deviate from your designed portfolio asset allocation) over your lifetime. As Warren Buffett has said, "My best holding period is forever." DCA provides a method in which to spread out risk in case we have another year like 2008 even if it does have expected lower returns. This rationale is certainly not without merit (sorry for the double negative) and for certain investors, DCA makes sense.
Note that even if you invest in a lump sum right now, you will still most likely be dollar cost averaging over the course of your lifetime as new funds become available. I like to rebalance by buying additional shares of my existing funds, rather then selling my underperforming asset classes (unless, of course, I am tax loss harvesting, in which case selling negatively performing asset classes is the way to go).
To wrap up, lump sum investing provides the higher expected return over dollar cost averaging. From a mathematical and probability standpoint, it is definitely the better method. However, there are psychological factors at play in many circumstances and certain individuals may find comfort in spreading out their risk over the course of a year or so, and thus will find the dollar cost averaging method more suitable for their goals since it reduces their risk of picking the exact wrong time to jump in the market. In the end, it won't make a huge difference over the course of a long-term investing lifetime. Getting a suitable plan in place and implementing it is far more important than the rate at which you will be transferring your assets from cash to stocks and bonds.

Tips, Analysis, and Ramblings About Individual Investing and Personal Finance
Schwab Now Offers Commission-Free ETFs
 I'm not sure how I missed this, but Schwab is now offering domestic and international ETFs with low expense ratios and they trade commission free for investors with Schwab accounts! This is a great and welcome move by Schwab to enter the ETF business. They are a couple years behind Barclays Global Investors (iShares), Vanguard, and State Street (SPDRs), so they certainly felt the pressure to add extra incentives (commission free and low costs).
You can see a comparison of the main four companies ETF offerings here. While Schwab certainly still doesn't have the breadth of offerings of the others, they do offer five domestic equity ETFs and three international equity ETFs that serve as a solid foundation for a portfolio. These are certainly nice choices for current Schwab customers who prefer the flexibility of ETFs as well as the increased ability to tax loss harvest. I wouldn't take the effort to move my accounts from Vanguard to Schwab, for example, quite yet. The differences are negligible, but increased competition is always a good thing and giving investors more low-cost indexed ETFs is definitely a positive. And the commission free aspect is icing on the cake!
I actually might use Schwab International Small-Cap Equity ETF (SCHC; available in January) with its 0.35% expense ratio as opposed to Vanguard FTSE All-World ex-US Sm Cp Index (VFSVX), which has a 0.75% purchase and redemption fee (on top of the 0.68% ER), or Vanguard's ETF version (VSS; 0.38% ER) since I got charged a commission every time I purchase that ETF. Many don't have International Small-Cap as part of their portfolio, so in that case, it would not be particularly important. Likewise, the Schwab Emerging Market ETF might be a viable alternative (for current Schwab customers) to Vanguard's fund, VEIEX, which charges a 0.25% purchase and redemption fee.
It's important to note that the Schwab domestic ETFs track slightly different indices than the Vanguard counterparts, so it's possible that these could be used for tax loss harvesting and wouldn't trigger a wash sale. Although please consult your financial professional to confirm this. It appears that the domestic ETFs track the Dow Jones indices, while the international ETFs track the FTSE indices.
You can read a discussion of these new offerings on a thread at the very pro-Vanguard site, Bogleheads. Some are resistant as they've thought for years that Vanguard is the best firm by far and nobody can challenge them, but, in the end, most welcome the increased offerings. I certainly do.
Update 1/7/10: Schwab has announced that they are reducing trade commissions to $8.95 to all clients regardless of portfolio size and activity starting 1/19/10. In the past, only those with greater than $1 million in household assets or those who traded at least 120 times per year got that rate - all others were $12.95. Schwab is really making a push to be a one-stop shop for all banking/investing needs. First, they created a high yield checking account and eventually a high yield savings. Then they reduced their expense ratios on their index funds to Vanguard-like levels that also only have a $100 minimum. They have a quality 2% cash back Visa. Then offering commission free ETFs and finally reducing commissions for trading stocks and ETFs! There are still a few places they are lacking, but they're certainly making a valiant effort to improve. They still don't have great bond fund choices as they're quite expensive (there are some on their OneSource list that are decent, however, such as those from Ridgeway), their fund offerings aren't nearly as extensive as Vanguard (e.g. no emerging markets), some of their funds seem to have higher tracking errors and tax cost ratios than their Vanguard counterparts, and they still charge a ridiculous $49.95 for every fund purchase not on the NTF list. However, Schwab is great for those with a small amount of assets and people who like to have all their money with one company as the multitude of positives outweigh those few negatives. I'm certainly a fan and welcome the changes; although they could be even better as could most firms.
Questions from the Mailbag - Segment 1
Below are some questions and answers based on e-mails or users' web searches that led them to the site:
Q: Should I hold TIPS in a taxable account?
A: Since bonds and bond funds are not very tax-efficient, they are best placed in tax-advantaged accounts such as a 401(k) or IRA. For tax efficient placement, consult this bogleheads article. Stock index funds tend to be the most tax efficient, while high yield bonds, REITs, and actively managed small caps lead to the most negative tax ramifications. Having said that, there are situations in which holding TIPS in taxable accounts makes sense. You should consider your portfolio as a single entity and determine your desired asset allocation. If, for instance, you decide that you want to dedicate 10% of your assets to Vanguard HY Corporate (VWEHX), 15% to Vanguard REIT Index (VGSIX), 10% to Vanguard Total Bond Market Index (VBMFX), and 10% to TIPS in the form of Vanguard Inflation Protected Securities (VIPSX), yet your retirement accounts only account for 30% of your total assets, then you have no choice but to place TIPS in a taxable account. Being the most tax efficient as possible is not nearly as important as maintaining your desired asset allocation based on your investing objectives, time frame, and risk tolerance. In the above hypothetical situation, High Yield Corporate Bonds and REITs are even more tax inefficient than TIPS, so it is the most logical to place those in tax-advantaged accounts first and purchase TIPS in taxable accounts. To make a long story short, ideally it is best to purchase TIPS in a tax-advantaged account if possible since they aren't the most tax efficient asset. However, there are certainly even more tax-inefficient investments and your asset allocation takes precedence. If the space in your tax-advantaged accounts don't allow for TIPS to be wholly purchased in them, then it is certainly a wise decision to purchase them in a taxable account over not purchasing them at all.
Q: How many assets should I have before investing in REITs?
A: There is no correct one size fits all answer to this question. I personally like REITs as a portion of one's portfolio as historically they have not been heavily correlated with other equities and returns have also been very strong. It's just a diversification argument; the more diversified you are, not only do you have greater protection against the downside, but the upside also has greater prospects. First, determine you desired allocation to REITs. Most plans allocate anywhere from zero to 20% of total assets. With a small amount of assets, I would recommend diversified REIT index funds as opposed to a single company. Vanguard REIT Index (VGSIX), for instance, requires a $3,000 minimum initial investment. For argument's sake, let's say you chose to dedicate 10% of your portfolio to REITs. In order to invest in this fund with your desired allocation (10% in this case), you need $30,000 in total assets. Further complicating this matter is the fact that REITS are incredible tax-inefficient and pay out 90% of their income in the form of dividends taxed at the normal income rate (i.e. not the 15% long-term capital gains tax rate). Thus, if you have no tax-advantaged accounts at all and a small amount of assets, I personally don't think the increased diversification is significant enough to overcome the tax burden and would just increase my allocation devoted to equities.
There are certainly other diversified REIT investments out there available besides the Vanguard fund. ETFs require no minimum investment and thus you could essentially have less than $100 and still devote some of your money to REITs. In that case, though, transaction costs would be prohibitively expense and ETFs make little sense for small purchases. Charles Schwab also offers the Schwab Global Real Estate Investor Fund (SWAIX) with just a $100 minimum. Thus, if you targeted a 10% allocation, your total assets just need to be $1000. And if you targeted a 20% allocation, you need just $500. That is certainly a viable alternative, although note that it has a fairly high 1.05% expense ratio and its performance has been largely different than Vanguard's "equivalent" fund (i.e. their investment choices are quite different than the index fund alternative; compare the charts and holdings information). Now, with such small amounts, it's not really going to make a big difference either way (i.e. choosing to invest in REITs or not), but getting invested in a diversified set of assets early could make sense to enforce good habits as long as you're keeping expenses low.
To that end, I typically recommend getting involved in REITs through a diversified index fund such as VGSIX with an allocation of 5-20%, so the absolute minimum assets that one should have before investing in REITs seems to be around $15,000, assuming you are comfortable with a 20% allocation. This is certainly not a set number for everybody and you should take your own personal circumstances into account, but it is a starting point at which I think diversifying with REITs will truly make a significant impact.
Q: Should I purchase a Total Bond Market Fund or TIPS?
A: I encourage the purchasing and allocation of funds to both. Just as advisers preach diversification across sectors and types of stock, it is important to diversify across the bond market. One might argue that the Total Bond Market (VBMFX) is enough diversification, but I personally believe TIPS (VIPSX) are also an important component of one's portfolio. If you don't have enough assets to invest in both, however, I'd most definitely start with the Total Bond Market fund. Many people encourage 2/3 of the bond allocation going towards Total Bond, while the remaining 1/3 goes to TIPS. Others say a 50/50 allocation makes more sense. Decide what makes the most sense for you. Another alternative to the Total Bond Market/TIPS split, is a Treasury fund (short-term or intermediate-term)/TIPS split in similar proportions. Some believe only Treasury bonds are fully dependable and thus avoid the corporate and mortgage related bonds. If somebody's bond portfolio was 50% Vanguard Intermediate-Term Treasury Fund (VFITX) and 50% Vanguard Inflation Protected Securities (VIPSX), I'd give that the go ahead most likely depending on their personal circumstances. Likewise, 2:1 or 1:1 Total Bond:TIPS ratio is also a well-rounded strategy as a play on the bond market.
Q: Would it be advisable to place my emergency savings in a short-term bond index fund?
A: Most financial advisers would tell you "no." Emergency savings are there in case disaster strikes, and you need the assets to be available and liquid, they argue. Bond funds do carry risk and you can certainly lose principle. Savings and money market accounts are safe, FDIC-insured, and reliable. I am, however, going to go against conventional wisdom and argue that in this current economic climate (i.e. extraordinarily low interest and money market fund rates), I think it does make sense for certain individuals to invest a portion of one's emergency savings in a short-term bond index fund, assuming the potential losses are acceptable. For example, placing 3-months living expense in a savings account and 6-months living expenses in a short-term bond fund (in which you plan to hold longer than the duration of the bond issues) assuming you can handle a 5% loss on your investment in those months would be an acceptable level of risk for the increased potential for returns, in my opinion. Note that typically advisers encourage a 6-month expenses emergency account, but in the current employment market, most have increased that to at least 9-months.
In taxable accounts, where emergency savings are typically placed (although it's possible to come up with a strategy to place them in tax-advantaged accounts), it might make sense to check out tax-free municipal bonds since other bond funds are typically not very tax efficient. Use a tax-equivalent yield calculator, such as the one found here, to find out if it makes sense based on current yield rates and your tax bracket. If so, I'd stash a portion of emergency savings in Vanguard Limited-Term Tax-Exempt (VMLTX) or something similar. If not, Vanguard Short-Term Treasury (VFISX), Vanguard Short-Term Bond Index (VBISX), or Vanguard Short-Term Investment Grade (VFSTX) are good choices. Jason Zweig argues in this September 19th Wall Street Journal article, that current conditions make Treasuries the riskiest type of bond right now ("If the economy improves and rates rise, [Treasuries] will get hammered. The longer the bond, the harder the hammering") and recommends Vanguard Short-Term Investment Grade (VFSTX), which currently yields 4.17% and has a duration of 1.97. You should not chase yield, however, under any circumstances. And with distributions coming up at the end of this year, you should be cautious when entering a bond fund at this juncture.
Q: Can Mutual Funds be shorted?
A: No, however, there are inverse mutual funds that increase in value when their market benchmarks go down. I do not recommend such funds. But if you're interested, the largest ones are offered by Rydex, ProFunds, and Direxion. There are also inverse ETFs and leveraged ETFs (that go twice the inverse the benchmark on a daily basis). For a list of inverse funds and ETFs, see here. I especially hate leveraged ETFs. They are extremely dangerous and do not behave the way most investors would expect. These should also be avoided. ETFs can be shorted, however. I likewise do not personally recommend such an action.
Q: Should I invest in index funds or actively managed funds?
A: Index funds have outperformed 60-70% of actively managed funds after taking expenses into account year after year after year. Those active funds that do outperform on any particular year, typically perform worse the next year. Chasing "hot" funds proves to be costly and index fund investing has shown to be a better, more cost efficient method. I subscribe to the "dollar cost averaging into diversified low-cost index funds over the long-term based on your objectives and risk tolerance" philosophy of investing.
Q: Should I hold Vanguard LifeStrategy Funds in a taxable account?
A: LifeStrategy Funds are all-in-one fund-of-funds that are designed to simplify investing and designate one's assets to various asset classes based on risk tolerance. Vanguard LifeStrategy Growth (VASGX) is the most aggressive fund, currently allocating 81% to stocks and 12% to bonds, while Vanguard LifeStrategy Income (VASIX) is the most conservative fund, allocating 22% to stocks and 65% to bonds. Since bonds are inefficient from a tax perspective, it does not make sense to hold a fund heavily invested in bonds in a taxable account. Due the simplicity of such a fund, one with an aggressive portfolio (i.e. skewed towards equities), a smaller number of assets, doesn't want to rebalance, or just wants an extremely simplified approach to dollar cost averaging or investing in general might choose a single all-in-one fund. However, because LifeStrategy funds hold the Vanguard Asset Allocation Fund, which adjusts its allocation and thus realize capital gains, these all-in-one funds are not as tax efficient as the Vanguard Target Retirement Funds, which do not hold the asset allocation fund. Thus, for those seeking an efficient all-in-one fund for a taxable account, look into the Target Retirement Fund with your desired asset allocation for the taxable portion of your assets. Ignore the year in the name; just look at the stock/bond percentages. You should still strive to hold most of your bonds in tax-advantaged accounts, but holding some in taxable accounts is okay. In the end, the Target Retirement Funds are better than the LifeStrategy fund for taxable accounts. Just make sure to revisit the allocation in the future as the target retirement funds automatically adjust as they get closer to the end date, unlike LifeStrategy funds. The tax advantages of TR funds, however, outweigh this negative.
Please send any investing questions to theinvestingguy (at) gmail (dot) com!
Lazy Portfolios
 Lazy Portfolios are passive investing techniques that use a diversified set of index funds to perform well in all market conditions. Such portfolios are suitable for most investors during the accumulation phase of their lifetimes as they typically possess 30-40% bonds. They require very little maintenance (rebalancing once or twice a year) and due to low fees associated with index funds, frequently outperform actively managed funds as well as the S&P 500 more generally. An even simpler way to have a lazy portfolio is simply to choose Vanguard LifeStrategy or Target Retirement funds (don't pay attention to the year in the name, choose based on your preferred bond allocation) and perhaps supplement it with an index fund or two to skew it in the direction of your liking.
As of 9/30/2009, all eight Lazy Portfolio's as tracked by MarketWatch's Paul Farrell have outperformed the S&P 500 for the trailing 1-, 3-, and 5-year periods as seen below.

Why have they performed so well? The key is that these portfolios offer protection against the downside and should perform well in a variety of market conditions, unlike the S&P 500. Since the stock market has been in a bearish phase the past five years, these portfolios have greatly outperformed. This may not continue in the future, but there is nobody that can predict the future, and these portfolios offer true diversification, which is key to long-term sustained reliable growth.
(Update: Looking at the portfolio performance through 10/27/09 when the S&P 500 is up over 28% in the last year further strengthens the argument to  hold such diversified portfolios. Although the market has been on a tear the past year, all of these funds except one have outperformed the S&P 500 despite that fact that most hold 30% or more bond funds; admittedly, bonds have also had a huge upswing in recent months. Aronson Family Taxable and Second Grader's Starter have approximately outperformed the S&P 500 by 10% in the past year. As they say, past performance does not guarantee future results. However, these results illustrate how these portfolios can perform well in bear and bull markets over the long-term. See graph to the right for complete results through 10/27/09.)
 hold such diversified portfolios. Although the market has been on a tear the past year, all of these funds except one have outperformed the S&P 500 despite that fact that most hold 30% or more bond funds; admittedly, bonds have also had a huge upswing in recent months. Aronson Family Taxable and Second Grader's Starter have approximately outperformed the S&P 500 by 10% in the past year. As they say, past performance does not guarantee future results. However, these results illustrate how these portfolios can perform well in bear and bull markets over the long-term. See graph to the right for complete results through 10/27/09.)
Some investors may want to supplement a lazy portfolio with individual stock picks if they have the time and knowledge base to do so. Just don't expect to pick winners every time - studies have shown that few people can reliably do so. But having 90% of your portfolio dedicated to a Lazy Portfolio and 10% dedicated to individual stock picking seems reasonable to me if you have the desire to do so. Note that these portfolios contain anywhere from 3 to 11 funds, all of which offered by Vanguard as they are the flagship low-cost index fund provider. Some of the funds are repetitive and can be consolidated (e.g. owning small growth and small value can just as easily be held by owning twice as much small blend) to get around the $60,000 minimum portfolio size required of the 11-fund portfolios.
There is no need to blindly follow such portfolios without considering your own personal goals and risk tolerance. The exact percentages are also not important - being in the ballpark is what is significant and rebalancing once a year is preferred. Using these as guides and modifying them slightly to suit your own needs is actually ideal, in my mind.
In addition, these don't specify if they are held in taxable or tax-deferred (i.e. retirement accounts) except for the Aronson Family Taxable. These should thus be seen as overarching percentages of all accounts combined. Based on tax-efficient investing, one should place certain securities in their retirement account over a taxable account and vice versa. For example, REIT funds should be exclusively in retirement accounts, bond funds should mostly be in retirement accounts due to tax inefficiency (except for muni bond funds), while the majority of your equity stake should be in taxable accounts. Consult this bogleheads wiki article for Principles of Tax Efficient Fund Placement and particulars.
Let's further examine the asset allocation of these eight portfolios more closely based on data available from the MarketWatch site.
Aronson Family Taxable
- Ted Aronson manages $25 billion of assets with AJO Partners
- 11 funds
- 0.27% aggregate weighted net expense ratio
- 70% Stocks / 30% Bonds
- 15% Vanguard Pacific Stock Index (VPACX)
- 15% Vanguard Inflation-Protected Securities Fund (VIPSX)
- 15% Vanguard 500 Index (VFINX)
- 10% Vanguard Extended Market Index Fund (VEXMX)
- 10% Vanguard Long-Term Treasury Fund (VUSTX)
- 10% Vanguard Emerging Markets Stock Index Fund (VEIEX)
- 5% Vanguard High-Yield Corporate Fund (VWEHX)
- 5% Vanguard Small-Cap Growth Index Fund (VISGX)
- 5% Vanguard European Stock Index Fund (VEURX)
- 5% Vanguard Total Stock Index Fund (VTSMX)
- 5% Vanguard Small-Cap Value Index Fund (VISVX)
Comments: One could easily combine 15% VFINX and 5% VTSMX to just 20% VTSMX as they are essentially the same. Likewise, you could combine 5% VISGX and 5% VISVX to be a 10% stake Vanguard Small-Cap Index (NAESX). These consolidations would make this a more manageable 9-fund portfolio. The small value and growth funds used to track different index than the small blend, but they have since all been aligned to track the same benchmark so performance should be similar. Note the absence of an REIT fund that is popular in the other Lazy Portfolios. This is most likely because this portfolio is explicitly for taxable accounts.
Fundadvice Ultimate Buy & Hold
- Paul Merriman of FundAdvice.com
- 11 funds
- 0.29% aggregate weighted net expense ratio
- 60% Stocks / 40% Bonds
- 20% Vanguard Intermediate-Term Treasury Fund (VFITX)
- 12% Vanguard Short-Term Treasury Fund (VFISX)
- 12% Vanguard International Value Fund (VTRIX)
- 12% Vanguard Developed Markets Index Fund (VDMIX)
- 8% Vanguard Inflation-Protected Securities Fund (VIPSX)
- 6% Vanguard Small-Cap Index (NAESX)
- 6% Vanguard Small-Cap Value Index Fund (VISVX)
- 6% Vanguard Value Index Fund (VIVAX)
- 6% Vanguard 500 Index Fund (VFINX)
- 6% Vanguard Emerging Markets Stock Index Fund (VEIEX)
- 6% Vanguard REIT Index Fund (VGSIX)
Comments: Again, the exact percentages are not imperative. This is a more conservative portfolio with 40% bonds, and skewed towards shorter duration treasuries (which I generally prefer as well).
Dr. Bernstein's Smart Money
- Dr. William Bernstein is a financial adviser for HNW individuals and wrote an article outlining this portfolio in SmartMoney ten years ago
- 9 funds
- 0.26% aggregate weighted net expense ratio
- 60% Stocks / 40% Bonds
- 40% Vanguard Short-Term Treasury Fund (VFISX)
- 15% Vanguard Total Stock Index Fund (VTSMX)
- 10% Vanguard Small-Cap Value Index Fund (VISVX)
- 10% Vanguard Value Index (VIVAX)
- 5% Vanguard Emerging Markets Stock Index Fund (VEIEX)
- 5% Vanguard European Stock Index Fund (VEURX)
- 5% Vanguard Small-Cap Index (NAESX)
- 5% Vanguard Pacific Stock Index (VPACX)
- 5% Vanguard REIT Index Fund (VGSIX)
Comments: Again, skewed towards short-term treasuries as well as small-cap, value, and emerging markets (typically, Europe accounts for 50% of total international funds, Pacific is 30%, and EM is 20%). Fairly conservative with a 40% bond allocation, all of which is going to Short-Term Treasuries, a non-diversified bond portfolio. I personally would swap in Vanguard Short-Term Bond (VBISX) or Vanguard Total Bond Market (VBMFX) for VFISX for increased diversification.
Coffeehouse
- Bill Schultheis is a former Smith Barney broker and author of The Coffeehouse Investor
- 7 funds
- 0.25% aggregate weighted net expense ratio
- 60% Stocks / 40% Bonds
- 40% Vanguard Total Bond Market Index (VBMFX)
- 10% Vanguard Small-Cap Value Index Fund (VISVX)
- 10% Vanguard REIT Index Fund (VGSIX)
- 10% Vanguard Total International Stock Index Fund (VGTSX)
- 10% Vanguard 500 Index Fund (VFINX)
- 10% Vanguard Value Index (VIVAX)
- 10% Vanguard Small-Cap Index (NAESX)
Comments: This strategy uses a diversified total bond fund to gain access to treasuries (25%), mortgage-backed (35%), corporate (18%), and foreign (5%) bonds.
Yale U's Unconventional
- David Swensen manages Yale's endowment
- 6 funds
- 0.24% aggregate weighted net expense ratio
- 70% Stocks / 30% Bonds
- 30% Vanguard Total Stock Index Fund (VTSMX)
- 20% Vanguard REIT Index Fund (VGSIX)
- 15% Vanguard Inflation-Protected Securities Fund (VIPSX)
- 15% Vanguard Long-Term Treasuries Fund (VUSTX)
- 15% Vanguard Developed Markets Index Fund (VDMIX)
- 5% Vanguard Emerging Markets Stock Index Fund (VEIEX)
Comments: The relatively high exposure to REITs have hurt this funds return in the past couple years. However, the REIT fund offers yet another diversification tool as REITs historically have not had high correlation values with the rest of the market. Swensen utilizes a more common 3:1 Developed:Emerging Markets ratio. Vanguard Developed Markets is about 65% Europe and 35% Pacific.
Dr. Bernstein's No Brainer
- 4 funds
- 0.24% aggregate weighted net expense ratio
- 75% Stocks / 25% Bonds
- 25% Vanguard Total Bond Market Index (VBMFX)
- 25% Vanguard 500 Index Fund (VFINX)
- 25% Vanguard European Stock Index Fund (VEURX)
- 25% Vanguard Small-Cap Index (NAESX)
Comments: This is a super simple, four fund evenly split portfolio. It again skews towards small-cap, but doesn't have any exposure to Pacific, emerging markets, or REITs, which I feel can offer potential for increased returns and diversification. With increased globalization of the financial markets, European and US Markets typically correlate very well. It's the emerging markets that typically differ. Replacing Vanguard European Stock Index Fund (VEURX) with Vanguard Total International (VGTSX) or Vanguard FTSE All-World ex-US Index (VFWIX) would be a wise decision, in my opinion. Then, adding a small position in Vanguard REIT Index (VGSIX) (reducing the small-cap fund percentage by the same amount) would make this a great 5-fund portfolio.
Margaritaville
- Scott Burns developed this portfolio for the Dallas Morning News
- 3 funds
- 0.26% aggregate weighted net expense ratio
- 67% Stocks / 33% Bonds
- 34% Vanguard Total Stock Index Fund (VTSMX)
- 33% Vanguard Total International Stock Index Fund (VGTSX)
- 33% Vanguard Inflation-Protected Securities Fund (VIPSX)
Comments: This is also an incredibly simple portfolio that makes a lot of sense. This overweights the international market more than all-in-one funds such as LifeStrategy or Target Retirement funds, and provides exposure to nearly every part of the world. This portfolio is also a good hedge again increased inflation, which is not a bad bet in this current economic status. But the bond allocation certainly isn't diversified.
Second Grader's Starter
- 3 funds
- 0.23% aggregate weighted net expense ratio
- 90% Stocks / 10% Bonds
- 60% Vanguard Total Stock Index Fund (VTSMX)
- 30% Vanguard Total International Stock Index Fund (VGTSX)
- 10% Vanguard Total Bond Market Index (VBMFX)
Comments: Similar to the Margaritaville portfolio, except the TIPS fund has been substituted with a TBM fund. This portfolio has underperformed the others not as a function of its simplicity, but due to its high exposure to equities (90%) unlike the other portfolios. Obviously, stocks have underperformed in the past five years. One could easily use this strategy as a starting point and skew it to the appropriate bond allocation based on your objectives and risk tolerance. (A typical bond allocation is your age in bonds or some say 110 minus your age equals an appropriate stock allocation.) If this had simply been a 33%/33%/33% split, it would have performed remarkably similar to the Margaritaville portfolio over the 5-year period. The total bond market index is more diversified and thus less volatile than the TIPS fund. Over the past 5 years, TBM has returned 5.18% annually, while TIPS have returned 4.67% annually. So, it would have outperformed Margaritaville had it had the same bond allocation. This is a Lazy Portfolio I highly recommend based on its simplicity, broad diversification, low expenses, and easy flexibility. I do like some exposure to REITs in retirement account, however, and this has none. Adding Vanguard REIT Index Fund (VGSIX) to this three fund portfolio to create a tailored four fund portfolio would make a lot of sense.
Investing Guy's Lazy Portfolio
- 6 funds
- 0.25% aggregate weighted net expense ratio
- 70% Stocks / 30% Bonds
- 25% Vanguard Total Stock Index Fund (VTSMX)
- 25% Vanguard Total International Stock Index Fund (VGTSX)
- 20% Vanguard Total Bond Market Index (VBMFX)
- 10% Vanguard Inflation-Protected Securities Fund (VIPSX)
- 10% Vanguard REIT Index Fund (VGSIX)
- 10% Vanguard Small-Cap Value Index Fund (VISVX)
Comments: This portfolio utilizes my preference for the a small-cap/value tilt on US equities, as well as exposure to REITs and TIPS. It also exposes you to foreign small caps unlike the other Lazy Portfolios as this should provide greater diversification and expected return. (Note: This statement is no longer true since Total International now includes small-cap international. See more details below). I attempt to keep it as simple as possible to make re-balancing and accounting easier, while also exposing you to nearly all portions of the market. (Some may argue that commodities are missing, but this is an area that shouldn't be touched by the average investor.)
The bond percentage is not a one size fits all, in my opinion. You should adjust that percentage (just increase or decrease VBMFX) based on your age, timeframe to retirement, and risk tolerance, and modify the rest accordingly. I use VFWIX over VGTSX (Total International Market) since it is slightly more tax-efficient (eligible for the foreign tax credit since it holds securities directly) and contains Canada (6%) unlike Total Int'l. However, VGTSX recently changed from being a fund-of-funds to also holding the stocks directly, so its tax efficiency should be nearly the same as VFWIX going forward and the blurring between these two funds gets even stronger. (I'd expect Vanguard eventually combines them.) If you want to slightly overweight Emerging Markets by holding a small position in Vanguard Emerging Markets Stock Index Fund (VEIEX) or further slice and dice into a Vanguard Developed Markets (VDMIX)/VEIEX blend instead of a single holding in VFWIX, that would look good to me as well.
The bond percentage is not a one size fits all, in my opinion. You should adjust that percentage (just increase or decrease VBMFX) based on your age, timeframe to retirement, and risk tolerance, and modify the rest accordingly. I use VFWIX over VGTSX (Total International Market) since it is slightly more tax-efficient (eligible for the foreign tax credit since it holds securities directly) and contains Canada (6%) unlike Total Int'l. However, VGTSX recently changed from being a fund-of-funds to also holding the stocks directly, so its tax efficiency should be nearly the same as VFWIX going forward and the blurring between these two funds gets even stronger. (I'd expect Vanguard eventually combines them.) If you want to slightly overweight Emerging Markets by holding a small position in Vanguard Emerging Markets Stock Index Fund (VEIEX) or further slice and dice into a Vanguard Developed Markets (VDMIX)/VEIEX blend instead of a single holding in VFWIX, that would look good to me as well.
As stated above, I recommend holding some small-cap international through a fund such as Vanguard FTSE All-World ex-US Small Cap Index (VFSVX; ER 0.78%; 0.75% purchase and redemption fees) or ETF such as VSS (ER 0.55%), Schwab International Small-Cap ETF (SCHC; ER 0.35%), or iShares MSCI EAFE Small Cap (SCZ; ER 0.4%). All are good choices, although too much slicing and dicing can over complicate your portfolio, so if this makes things harder to keep track of and maintain for you, then it's best to avoid it. Keep it simple. I'd see nothing wrong with moving that 5% to the large cap international fund (VFWIX) to make large cap international a full 25%. The various funds and ETFs mentioned at the beginning of this paragraph may track different indicies, so that's something to be aware of, although the differences will most likely be small. A reasonable percentage of small-cap international is about 20-25% of your total international holdings. (Simply reduce or increase your large-cap international holding by the same amount. That is, keep your total international target the same.) Thus, if you have a relatively small portfolio (<$100,000), then your small-cap international holding probably won't make a significant difference in the long run.
Update 10/25/10: Vanguard is adjusting their Total International Index (VGTSX) to track the MSCI All Country World ex USA Investable Market Index in the near future. This new fund will include the market share of small-caps (~15%) and thus is a perfect all-in-one solution for foreign exposure. This fund's investor expense ratio is 0.32% and will also be offering admiral (>$10,000 investment) and ETF class shares for even cheaper. When these changes will take place it still uncertain, but people are speculating they will occur sometime in Q1 2011.
Update 1/31/11: Vanguard's international fund now follows the above mentioned index. Thus, I have modified it to simply including one international fund instead of a large-cap international and small-cap international. Fewer holdings should make it easier to track.
If the seven funds make it too complicated to re-balance, keep track of, or dollar cost average for you, I'd go with a VTSMX (40%), VBMFX (25%), VFWIX VGTSX now (25%), and VGSIX (10%) portfolio assuming you want a 75/25 stock/bond split. That four fund portfolio (as I said in the comments for Second Grader's Starter) is perfect for many individuals and I recommend it highly. Vanguard recommends holding 20-40% of your equity stake in foreign markets, and I have it at approximately the 36% mark, if you count REITs as part of US equity (which some may and others may not). The market cap of non-US equities has climbed to 59% of the global market cap (check out the X-Ray of Vanguard Total World Stock Index, VTWSX) and Vanguard suggests that as an upper limit. However, their analysis indicates there is incremental benefit in having more than 40% in international stock based on the increased risk (such as currency volatility), so they substitute 40% as the recommended upper limit. Just choose something you are comfortable with and stick with it. Try to hold as much of the bond and REIT portions of your portfolio in tax-advantaged accounts as these are not very tax efficient. Stock funds are very tax efficient so you should hold these in taxable accounts.
Overall comments: Note the expense ratios hover around 0.25%. That is certainly very low, but still above Target Retirement funds which are approximately 0.20%. This 0.05% difference is only $5 difference a year for every $10,000 invested, so it's certainly nothing to worry about, but the point is that from a fund expense standpoint, the self contained fund-of-funds indexing (i.e. TR funds) is not any worse than the do-it-yourself approach (i.e. Lazy Portfolios). Also note that these expense ratios are for investor class shares, but Vanguard reduced the investment amount to qualify for the lower-cost Admiral shares to only $10,000 in October 2010. Thus, if your portfolio is a decent size, you could easily take advantage of these lower costs and lose even less of your investment gains to fees.
The Lazy Portfolios just give you more flexibility to choose the percentages as you see fit and allow you to hold the funds in a more tax efficient manner. One should be aware of the potential tax consequences of holding bond funds in taxable accounts if you go the single fund approach. It's also interesting to examine some commonalities between the various portfolios; they are typically skewed towards small-cap, value, REITs, international, emerging markets, short-term treasuries, and/or TIPS moreso than the TR/LifeStrategy Funds.
Here is a graphical representation of all the eight aforementioned portfolios' asset allocations based on the categories of the particular funds:


You can dissect these and go back and forth on what you think is the best approach forever, but in the end, just choose a strategy and stay the course. One is not significantly better than the other; the key thing to determine is your age and tolerance for risk, which should determine your bond allocation. Don't deviate from your plan. That has proven time and time again to be catastrophic. Choosing one of these portfolios requires perhaps a one hour time commitment a year to rebalance and monitor the performance. It's really a great way to beat those attempting to time the market, make individual stock picks, etc. And you'll rest easy at night and have time to dedicate to more important things in life.
If you want to dollar cost average over time into funds and don't want to rotate which fund you set up for an automatic investment plan, it might make sense to invest in a Target Retirement or LifeStrategy fund that has an appropriate allocation of bonds and then supplement it with index funds that you find appropriate. These funds contain the Total US Stock Market, the Total Bond Market, the European Market, Pacific Market, and Emerging Markets. You can supplement that core holding with small-cap, value, TIPS, REIT, and perhaps more international equities or short-term treasury funds. It's easy to personalize it and you can dollar cost average into the core fund, which won't significantly alter your asset allocation.
Do some research and choose a Lazy Portfolio that's right for you or create your own. You won't regret it.
Harry Browne's Permanent Portfolio
 An intriguing investing strategy is Harry Browne's Permanent Portfolio, as outlined in his book Fail-Safe Investing (St. Martin's Griffin, 2001, 176 pp). Essentially, it seeks to increase purchasing power over the long-term through all economic cycles by dividing assets in four equal parts: gold, bonds, stocks, and cash.
Admittedly, I haven't read the book, but I found the strategy so interesting that I had to post about it; I plan to get the book shortly. Thus, this post will be based mostly on information found on his website (although it's only updated through 2003; Browne passed away in 2006 and apparently nobody else has updated his site), this My Money Blog post, and this Crawling Road post (the author utilizes this strategy for his own assets). I've got to make sure to give credit to my sources!
So, unlike most posts, this one will have no original analysis based on the primary source; rather, I'll be relaying and condensing the data and information extracted by other individuals, while interspersing my own comments throughout and showing graphical representations of data that other individuals have gathered. In addition, it's important to note that Browne encourages dividing one's assets into a more aggressive "variable portfolio" to augment returns in addition to the "permanent portfolio," which is the conservative segment intended to survive any possible disaster. With all that said, let's get to it and examine the strategy and its past performance.
Premise and Allocation
The basic premise behind the Permanent Portfolio is to preserve and increase purchasing power over the long-term through any economic cycle: prosperity, inflation, deflation, and recession. Browne sees market timing and predicting future market cycles as a futile affair and posits a portfolio that contains an asset class that theoretically should greatly outperform all others in each of those economic times. Since the timing and length of such cycles is an unknown variable, the Permanent Portfolio is divided into four evenly sized segments as follows:
- 25% Gold (Physical gold bullion; outperforms in inflationary environments)
- 25% Stocks (S&P 500 or Total Stock Index Fund; outperforms in times of prosperity)
- 25% Bonds (Long-term Treasury Bonds; outperforms in deflationary environments)
- 25% Cash (Treasury Money Market fund; outperforms during recessions)
These four asset classes respond to each market condition differently and perhaps offer a more diversified portfolio allocation than the traditional stock/bond mix that most financial advisers espouse. Gold bullion is perhaps the best asset class to provide a hedge against inflation and decreasing value of the dollar. Stocks capture the rapid upwards movement of the market during prosperous times. Long-term bond prices go up in value considerably during times of deflation and also fare reasonably well during prosperity. Finally, cash serves as a buffer for losses during recessionary periods and also performs well during deflation.
According to his website, the worst year of the permanent portfolio since 1970 was a 6.2% loss in 1981. The S&P 500, on the other hand, has had nine years of losses greater than 6% since 1972, with the worst being -38.24% in 2008. However, the S&P 500 has also had ten years of 20%+ returns since 1972, while the Permanent Portfolio has had only two. In the end, the Permanent Portfolio has averaged about 9-10% since the early 1970s, approximately the same Compound Annual Growth Rate as the stock market, but with less volatility. Given that 50% of the portfolio is bonds/cash, it's definitely a conservative strategy and would seemingly underperform equities over the long-term. Note that investing in gold bullion directly can be somewhat of a logistical challenge depending on the particular circumstances.
Where and How to Invest
The following investment choices are good places to start looking for each asset class:
- Gold: SPDR Gold Trust ETF (GLD; 0.4% expense ratio; 0% dividend yield) and iShare COMEX Gold Trust ETF (IAU; 0.4% expense ratio; 0% dividend yield), no mutual funds available to invest in gold bullion directly
- Stocks: Vanguard Total Stock Market ETF (VTI; 0.07% expense ratio, 2.45% dividend yield), Vanguard Total Stock Market (VTMSX; 0.18% expense ratio, 2.18% dividend yield), Vanguard 500 Index (VFINX; 0.18% expense ratio, 2.52% dividend yield), Schwab S&P 500 Index (SWPPX; 0.09% expense ratio, 2.75% dividend yield), Schwab Total Stock Market Index (SWTSX; 0.09% expense ratio, 2.11% dividend yield), Fidelity Spartan 500 (FSMKX; 0.10% expense ratio, 2.62% dividend yield)
- Bonds: iShares Barclays 20+ Year Treasury Bond ETF (TLT; 0.15% expense ratio, 4.12% yield), Vanguard Long-Term US Treasury Bond Fund (VUSTX; 0.25% expense ratio, 4.06% yield)
- Cash: iShares Barclays Short Treasury ETF (SHV; 0.15% expense ratio, 1.28% yield), SPDR Barclays Capital 1-3 Month Treasury ETF (BIL; 0.14% expense ratio, 0.81% yield), Vanguard Treasury Money Market Fund
To determine if ETFs or mutual funds make more sense for you, please refer to this post.
In the book, Browne suggests checking the portfolio once each quarter and then rebalancing if any of the asset classes outperformed or underformed by more than 10%.
Permanent Portfolio Mutual Fund (PRPFX)
Although creating this portfolio yourself reduces costs and expenses, there is an easier commercially available mutual fund available that in general follows this principle - the Permanent Portfolio (PRPFX; 0.84% expense ratio, 0.71% dividend yield).
This fund, somewhat surprisingly, has no load or extra fees; it also doesn't even have a transaction fee through my Schwab and Vanguard accounts even though its managed by Permanent Portfolio. This is fairly rare for funds outside the brokerage firm and helps tremendously with the fees and expenses associated with the purchasing of shares. The expense ratio of 0.84% is certainly much higher than index funds, but is reasonable (it's probably on the lower end) for an actively managed fund. It has a minimum investment of $1,000, which is fairly low, although this minimum increases slightly if you don't want to pay transaction fees through your brokerage firm (Schwab minimum is $2,500 General/$1,000 IRA; through Vanguard, it is $3,000 General/$1,000 IRA).
There are some important distinctions between PRPFX and the 25/25/25/25 method, however. Its current allocation is 7.4% cash, 39.47% stocks, 34.76% bonds, and 18.31% other. Morningstar gives it a conservative allocation category as well as 5-star ratings (the highest) based on its return in the trailing 3-, 5-, and 10-year periods as well as overall. Its return is categorized as "high," while its risk level is "above average." (Note that it's comparing the fund to other conservative allocation funds).
Examining the PRPFX prospectus that can be viewed through Schwab's site here, one can see that the fund invests its assets in the following asset classes (with target percentage in parenthesis): gold (20%), silver (5%), Swiss franc assets (10%), stocks of U.S. and foreign real estate and natural resource companies (15%), aggressive growth stocks (15%), and U.S. Treasury securities and short-term corporate bonds (35%). Although this differs from Browne's proposed allocation slightly, the performances generally have been quite similar over the years so it's certainly a reasonable alternative for those who don't want to do all the work themselves. In fact, I think using the mutual fund makes more sense than creating your own allocation for the vast majority of individuals who are choosing to use this investing strategy.
It's important to notice that this fund (and this strategy in general) has a very low dividend yield (0.71% vs. ~2.5% for S&P 500 Index Fund) and high expense ratio (0.84% vs. 0.18% for S&P 500 Index Fund), so it's at a significant disadvantage from the onset and must severely outperform stocks for the total returns to be better. Gold and silver generate no interest or dividends whatsoever. For the importance of dividend investing and the power of compounding dividends over the long-term, see my post here.
Historical Performance
With those caveats (i.e. ignoring expenses and dividends), let's look at the year-by-year performance of such a strategy since 1972 based on the information provided in the Crawling Road blog post. This assumes a 25% split among all four asset classes and rebalancing at the end of each year. The worst asset class for a given year will be highlighted in Red (red font doesn't mean it's necessarily negative, just the worst performing), while the best performing asset class will be in Green. Down years overall will be highlighted in Red. For comparison purposes, the yearly Permanent Portfolio annual return through 2003 as reported by Harry Browne himself and the annual return of the commercially available PRPFX fund as reported in the prospectus (since 1997) will also be included for comparison purposes.
TSM = Total Stock Market Index
ST = Treasury 1-2 year Short Term Bonds
LT = Treasury 20+ year Long Term Bonds
Gold = Gold Bullion
Avg = Annual Return (includes interest and reinvested dividends)
HB = Annual Return as reported by Harry Browne (not available after 2003)
PRPFX = Annual Return of PRPFX fund (not available before 1997)
Annual Returns (%) of Different Investments (1972-2008)
| Year | TSM | ST | LT | Gold | Avg | HB | PRPFX |
|---|---|---|---|---|---|---|---|
| 1972 | 16.9 | 3.9 | 5.7 | 48.9 | 18.8 | 18.7 | N/A |
| 1973 | -18.1 | 6.1 | -1.1 | 75.6 | 15.6 | 10.6 | N/A |
| 1974 | -27.2 | 9.1 | 4.4 | 70.5 | 14.2 | 12.3 | N/A |
| 1975 | 38.7 | 7.9 | 9.2 | -22.7 | 8.3 | 3.7 | N/A |
| 1976 | 26.7 | 8.9 | 16.8 | -3.8 | 12.2 | 10.1 | N/A |
| 1977 | -4.2 | 3.7 | -0.7 | 23.5 | 5.6 | 5.2 | N/A |
| 1978 | 7.5 | 5.5 | -1.2 | 36.7 | 12.1 | 15.0 | N/A |
| 1979 | 23.0 | 10.4 | -1.2 | 136.3 | 42.1 | 36.7 | N/A |
| 1980 | 32.7 | 14.1 | -4.0 | 10.8 | 13.4 | 22.1 | N/A |
| 1981 | -3.7 | 18.9 | 1.9 | -32.8 | -3.9 | -6.2 | N/A |
| 1982 | 20.8 | 19.5 | 40.4 | 12.5 | 23.3 | 23.3 | N/A |
| 1983 | 22.0 | 8.6 | 0.7 | -14.3 | 4.2 | 4.3 | N/A |
| 1984 | 4.5 | 12.8 | 15.5 | -20.2 | 3.2 | 1.1 | N/A |
| 1985 | 32.2 | 13.2 | 31.0 | 6.9 | 20.8 | 20.1 | N/A |
| 1986 | 16.1 | 11.9 | 24.5 | 22.9 | 18.8 | 21.7 | N/A |
| 1987 | 1.7 | 6.0 | -2.9 | 20.2 | 6.2 | 5.3 | N/A |
| 1988 | 18.0 | 5.9 | 9.2 | -15.7 | 4.3 | 3.6 | N/A |
| 1989 | 28.9 | 8.7 | 17.9 | -1.7 | 13.5 | 14.8 | N/A |
| 1990 | -6.0 | 8.9 | 5.8 | -2.2 | 1.6 | -0.7 | N/A |
| 1991 | 34.7 | 10.7 | 17.4 | -10.4 | 13.1 | 11.5 | N/A |
| 1992 | 9.8 | 6.8 | 7.4 | -6.2 | 4.4 | 4.0 | N/A |
| 1993 | 10.6 | 6.4 | 16.8 | 17.7 | 12.9 | 12.6 | N/A |
| 1994 | -0.2 | -0.6 | -7.0 | -2.2 | -2.5 | -2.4 | N/A |
| 1995 | 35.8 | 12.1 | 30.1 | -5.9 | 18.0 | 16.6 | N/A |
| 1996 | 21.0 | 4.4 | -1.3 | -4.6 | 4.9 | 5.2 | N/A |
| 1997 | 31.0 | 6.4 | 13.9 | -21.5 | 7.5 | 6.7 | 6.7 |
| 1998 | 23.3 | 7.4 | 13.1 | -0.3 | 10.8 | 7.4 | -2.0 |
| 1999 | 23.8 | 1.9 | -8.7 | -0.2 | 4.2 | 4.7 | 3.3 |
| 2000 | -10.6 | 8.8 | 19.7 | -5.3 | 3.2 | 2.7 | 5.88 |
| 2001 | -11.0 | 7.8 | 4.3 | 2.4 | 0.9 | -1.0 | 3.81 |
| 2002 | -21.0 | 8.0 | 16.7 | 24.4 | 7.0 | 7.2 | 14.36 |
| 2003 | 31.4 | 2.4 | 2.7 | 19.6 | 14.0 | 11.8 | 20.45 |
| 2004 | 12.5 | 1.0 | 7.1 | 5.6 | 6.6 | N/A | 12.05 |
| 2005 | 6.0 | 1.8 | 6.6 | 18.1 | 8.1 | N/A | 7.62 |
| 2006 | 15.5 | 3.8 | 1.7 | 23.0 | 11.0 | N/A | 13.82 |
| 2007 | 5.5 | 5.9 | 9.2 | 30.9 | 12.9 | N/A | 12.43 |
| 2008 | -36.7 | 6.2 | 33.4 | 4.9 | 1.9 | N/A | -8.36 |
| Avg | 11.1 | 7.7 | 9.6 | 11.9 | 10.0 | 9.6 | 7.5 ('97-p) |
Sources: Crawling Road blog, HarryBrowne.org, The Permanent Portfolio Family and Funds Prospectus dated 6/1/2009
First, some observations about the above data. Just as Browne suggested, it's impossible to predict economic cycles from year-to-year and the asset class that outperformed one year, can just as easily be the worst performer the next. There is no discernible pattern as to which of the four categories will be best and worst in a given year and thus it is best to spread your assets amongst all the classes to reduce risk and volatility.
It is accepted that gold and stocks are the most volatile; in the 37 years of the analysis, gold performed the best or worst in 28 of them while stocks performed was the best or worst performer in 26 of them. Short-term and long-term bonds serve to moderate the volatility.
In the end, there were only two years of a negative return using this strategy (with the greatest single year loss in 1981 at -6.2% as reported by Harry Browne and -3.2% as reported by Crawling Road) as compared to ten years for the stock market (with the greatest loss of -36.7% in 2008). This strategy does seem to moderate risk as it performed well under all market conditions.
The Permanent Portfolio Strategy had a calculated Compound Annual Growth Rate (CAGR) of 9.79%, where the total stock market had a CAGR of 9.40% (i.e. virtually the same, but with greater risk and volatility). Finally, note that while the calculated average gain based on the 25/25/25/25 strategy and Browne's reported returns are quite similar, PRPFX certainly has somewhat varied results although they definitely mimic both strategies. Notably, the use of silver, swiss franc assets, and particular sectors of stocks (real estate, natural resource, and aggressive growth) probably make the number stray slightly from the others.
(Update: As of 11/23/2009, the Permanent Portfolio is up 13.21% YTD including capital gains, interests, and dividends. Gold is up about 31%, stocks are up 25%, short-term bonds are +0.2%, while long-term treasuries have sunk nearly 18%.)
Analysis
Now, let's look at a graphical representation of the Permanent Portfolio vs. the Total Stock Market over the course of this data (1972-2008).
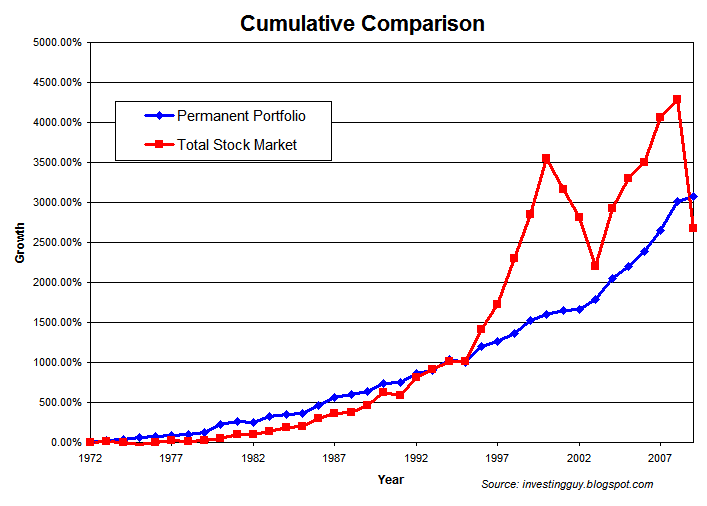
As you can see, they end up near the same percentage gain. From the start of 1972 to the end of 2008, the Permanent Portfolio strategy gained 3069%, while the Total Stock Market returned 2677%. Their CAGR's, again, are 9.79% and 9.40% respectively. Thought of another way, if you started with $10,000 in 1972, it would be worth $316,900 today using the Permanent Portfolio vs. $277,710 investing in the total stock market.
While they ended up in similar places, how they got there was quite different. You can see that from 1972 to 1995, there wasn't that grave of a difference (although certainly the stock market had more volatility as evidenced by the yearly annual returns in the graph printed below). However, starting in 1995, the stock market caught on fire as compared to the other classes and the total stock market severely outpeformed the Permanent Portfolio until 2000, when the market crashed again, and then outperformed it once more until 2008, when it crashed once more.
That is, the Permanent Portfolio performed reasonably well in all market conditions. It takes more of the "tortoise approach" in the tortoise and the hare analogy - it's slow, steady, and fairly reliable when compared to the antics of the stock market. It uses diversification in asset classes and economic conditions to increase purchasing power over time. The stock market, as the "hare," is more unpredictable and thus could severely outperform this strategy over the next 20 years. It could also underperform. There is no way to know. Even though these strategies ended up near the same point over this time period based on historical returns, there is no guarantee (in fact, it's probably unlikely) that they will perform similarly over the next 20 years. As they say, past results do not guarantee future returns.
Since gold was price controlled before 1971, it had a huge run-up from 1972 to 1974, so perhaps the starting point of this analysis is not fair. If we start in 1974, however, the end result is largely the same in that both perform similarly over the long-term (in this case, the stock market would have narrowly outperformed the Permanent Portfolio).
Let's also take a look at the year-to-year fluctuations of the Permanent Portfolio vs. the total stock market:

As already explained above, but more visually clear in the above graph, the stock market has much more volatility (and thus greater risk) than the permanent portfolio. As I said in my market timing post, market timing will always lag buy-and-hold during long-lasting bull markets. Similarly, it is clear that the permanent portfolio will lag the total stock market during periods of economic prosperity. But the point is that you don't know when or how long the economy will be in a recession, depression, prosperous cycle, deflationary, or inflationary period. Thus, according to Browne, you need to cover all your bases and be prepared for all possible scenarios.
Let's also take a look at the performance of the commercially available mutual fund, PRPFX (blue), vs. the S&P 500 (red) since its inception in 1996.
Permanent Portfolio Fund (PRPFX) vs. S&P 500

Source: Yahoo! Finance
As you can see, PRPFX has performed fairly well (hence its 5-star morningstar rating). We know that hot funds one day become cold the next, but this fund clearly has lower volatility than the stock market at large. During the huge bull market of 1996-2000, this fund did basically nothing and its percentage gains did not mimic the one's reported by the 25/25/25/25 strategy or Browne's website. Perhaps a new fund manager appeared or the strategy was modified at that point, as it seems the numbers more similarly mirror those of the espoused strategy from there on out.
During the bull market of 2000-2002, PRPFX was generally flat for the first half, but picked up major (positive) steam in 2002 when stocks plummeted. Overall, in its first six years, the fund was fairly stagnant with no major fluctuations, while the stock market had risen above a 120% gain only to fall to about the +75% level at the conclusion of 2002 (a 45% drop).
Since 2002, PRPFX has done very well. It mimicked the gains of the stock market during the 2002-2007 bull market, perhaps even outperforming the market. Then when the market starting declining at the end of 2007 and into early 2008, PRPFX continued to rise in price. Finally, when the market imploding at the end of 2008, PRPFX also took a hit, but not nearly as bad as the market as the other asset classes protected the fall and provided a hedge against the market.
As of September 2009, PRPFX is nearly at its highest point since its inception at nearly +110% since mid-1996, while the S&P 500 is hovering 65% below its 2000 and 2007 highs, although nearing +60% since mid-1996.
Conclusion
The Permanent Portfolio's conservative investing strategy was certainly all the rage during the 1980s when high inflation and poor market returns where the norm. In the 1990s, with stocks having one of the biggest run-ups in US history, this strategy perhaps returned to the backburner. Now that stocks have had paltry gains, if any, over the past decade, this strategy is perhaps coming to people's attention once again.
That isn't what Browne would want though - he'd want you to keep this portfolio in thick and thin because you cannot predict the future markets and economic cycles on the US and the world. This portfolio protects you against the downside by providing hedges against certain assets, while trying to capture the massive gains sometimes given by gold and stocks. It was intended to be for assets that you will need in life - such as retirement accounts. He suggested a separate portion of your portfolio can be more speculative, risky, and aggressive in nature - and named this the Variable Portfolio.
In conclusion, from the various performance results and back-testing, it does seem that the Permanent Portfolio holds up in poor economic times, while capturing many of the gains during prosperity. For those who want to have a more conservative strategy, instead of just increasing your bond percentage as most advisers would recommend, it might make sense to look into putting together a 25/25/25/25 strategy or invest in PRPFX with the portion of your assets that you cannot deal with declining significantly in value. For the majority of individuals, I don't recommend this strategy as gold is a speculative commodity that pays no dividends and doesn't have any real expected gain (unlike stocks that pay dividends and grow over time) and a full 75% of the portfolio is essentially a hedging strategy against economic prosperity (an excessive amount of cash, LT bonds, and gold, in my opinion). Having said that, I do like the idea of stable portfolio that does not attempt to time the market or economic cycles and is able to increase purchasing power over time much more significantly than money market funds.
With this strategy having such success the past ten years (namely due to the poor returns in stock and gold reaching an all-time high), this strategy is back in vogue. Investors should be careful not to chase performance and past results are no guarantee of the future. For certain individuals, it might make sense to explore employing certain facets of the permanent portfolio for a portion of one's overall portfolio; however, in general, I still think a well-diversified, age and risk-specific tolerance allocation of stocks and bonds through low-cost index funds is the way to go for the overwhelming majority of the population.
Subscribe to:
Posts (Atom)