
 An intriguing investing strategy is Harry Browne's Permanent Portfolio, as outlined in his book Fail-Safe Investing (St. Martin's Griffin, 2001, 176 pp). Essentially, it seeks to increase purchasing power over the long-term through all economic cycles by dividing assets in four equal parts: gold, bonds, stocks, and cash.
Admittedly, I haven't read the book, but I found the strategy so interesting that I had to post about it; I plan to get the book shortly. Thus, this post will be based mostly on information found on his website (although it's only updated through 2003; Browne passed away in 2006 and apparently nobody else has updated his site), this My Money Blog post, and this Crawling Road post (the author utilizes this strategy for his own assets). I've got to make sure to give credit to my sources!
So, unlike most posts, this one will have no original analysis based on the primary source; rather, I'll be relaying and condensing the data and information extracted by other individuals, while interspersing my own comments throughout and showing graphical representations of data that other individuals have gathered. In addition, it's important to note that Browne encourages dividing one's assets into a more aggressive "variable portfolio" to augment returns in addition to the "permanent portfolio," which is the conservative segment intended to survive any possible disaster. With all that said, let's get to it and examine the strategy and its past performance.
Premise and Allocation
The basic premise behind the Permanent Portfolio is to preserve and increase purchasing power over the long-term through any economic cycle: prosperity, inflation, deflation, and recession. Browne sees market timing and predicting future market cycles as a futile affair and posits a portfolio that contains an asset class that theoretically should greatly outperform all others in each of those economic times. Since the timing and length of such cycles is an unknown variable, the Permanent Portfolio is divided into four evenly sized segments as follows:
- 25% Gold (Physical gold bullion; outperforms in inflationary environments)
- 25% Stocks (S&P 500 or Total Stock Index Fund; outperforms in times of prosperity)
- 25% Bonds (Long-term Treasury Bonds; outperforms in deflationary environments)
- 25% Cash (Treasury Money Market fund; outperforms during recessions)
These four asset classes respond to each market condition differently and perhaps offer a more diversified portfolio allocation than the traditional stock/bond mix that most financial advisers espouse. Gold bullion is perhaps the best asset class to provide a hedge against inflation and decreasing value of the dollar. Stocks capture the rapid upwards movement of the market during prosperous times. Long-term bond prices go up in value considerably during times of deflation and also fare reasonably well during prosperity. Finally, cash serves as a buffer for losses during recessionary periods and also performs well during deflation.
According to his website, the worst year of the permanent portfolio since 1970 was a 6.2% loss in 1981. The S&P 500, on the other hand, has had nine years of losses greater than 6% since 1972, with the worst being -38.24% in 2008. However, the S&P 500 has also had ten years of 20%+ returns since 1972, while the Permanent Portfolio has had only two. In the end, the Permanent Portfolio has averaged about 9-10% since the early 1970s, approximately the same Compound Annual Growth Rate as the stock market, but with less volatility. Given that 50% of the portfolio is bonds/cash, it's definitely a conservative strategy and would seemingly underperform equities over the long-term. Note that investing in gold bullion directly can be somewhat of a logistical challenge depending on the particular circumstances.
Where and How to Invest
The following investment choices are good places to start looking for each asset class:
- Gold: SPDR Gold Trust ETF (GLD; 0.4% expense ratio; 0% dividend yield) and iShare COMEX Gold Trust ETF (IAU; 0.4% expense ratio; 0% dividend yield), no mutual funds available to invest in gold bullion directly
- Stocks: Vanguard Total Stock Market ETF (VTI; 0.07% expense ratio, 2.45% dividend yield), Vanguard Total Stock Market (VTMSX; 0.18% expense ratio, 2.18% dividend yield), Vanguard 500 Index (VFINX; 0.18% expense ratio, 2.52% dividend yield), Schwab S&P 500 Index (SWPPX; 0.09% expense ratio, 2.75% dividend yield), Schwab Total Stock Market Index (SWTSX; 0.09% expense ratio, 2.11% dividend yield), Fidelity Spartan 500 (FSMKX; 0.10% expense ratio, 2.62% dividend yield)
- Bonds: iShares Barclays 20+ Year Treasury Bond ETF (TLT; 0.15% expense ratio, 4.12% yield), Vanguard Long-Term US Treasury Bond Fund (VUSTX; 0.25% expense ratio, 4.06% yield)
- Cash: iShares Barclays Short Treasury ETF (SHV; 0.15% expense ratio, 1.28% yield), SPDR Barclays Capital 1-3 Month Treasury ETF (BIL; 0.14% expense ratio, 0.81% yield), Vanguard Treasury Money Market Fund
To determine if ETFs or mutual funds make more sense for you, please refer to this post.
In the book, Browne suggests checking the portfolio once each quarter and then rebalancing if any of the asset classes outperformed or underformed by more than 10%.
Permanent Portfolio Mutual Fund (PRPFX)
Although creating this portfolio yourself reduces costs and expenses, there is an easier commercially available mutual fund available that in general follows this principle - the Permanent Portfolio (PRPFX; 0.84% expense ratio, 0.71% dividend yield).
This fund, somewhat surprisingly, has no load or extra fees; it also doesn't even have a transaction fee through my Schwab and Vanguard accounts even though its managed by Permanent Portfolio. This is fairly rare for funds outside the brokerage firm and helps tremendously with the fees and expenses associated with the purchasing of shares. The expense ratio of 0.84% is certainly much higher than index funds, but is reasonable (it's probably on the lower end) for an actively managed fund. It has a minimum investment of $1,000, which is fairly low, although this minimum increases slightly if you don't want to pay transaction fees through your brokerage firm (Schwab minimum is $2,500 General/$1,000 IRA; through Vanguard, it is $3,000 General/$1,000 IRA).
There are some important distinctions between PRPFX and the 25/25/25/25 method, however. Its current allocation is 7.4% cash, 39.47% stocks, 34.76% bonds, and 18.31% other. Morningstar gives it a conservative allocation category as well as 5-star ratings (the highest) based on its return in the trailing 3-, 5-, and 10-year periods as well as overall. Its return is categorized as "high," while its risk level is "above average." (Note that it's comparing the fund to other conservative allocation funds).
Examining the PRPFX prospectus that can be viewed through Schwab's site here, one can see that the fund invests its assets in the following asset classes (with target percentage in parenthesis): gold (20%), silver (5%), Swiss franc assets (10%), stocks of U.S. and foreign real estate and natural resource companies (15%), aggressive growth stocks (15%), and U.S. Treasury securities and short-term corporate bonds (35%). Although this differs from Browne's proposed allocation slightly, the performances generally have been quite similar over the years so it's certainly a reasonable alternative for those who don't want to do all the work themselves. In fact, I think using the mutual fund makes more sense than creating your own allocation for the vast majority of individuals who are choosing to use this investing strategy.
It's important to notice that this fund (and this strategy in general) has a very low dividend yield (0.71% vs. ~2.5% for S&P 500 Index Fund) and high expense ratio (0.84% vs. 0.18% for S&P 500 Index Fund), so it's at a significant disadvantage from the onset and must severely outperform stocks for the total returns to be better. Gold and silver generate no interest or dividends whatsoever. For the importance of dividend investing and the power of compounding dividends over the long-term, see my post here.
Historical Performance
With those caveats (i.e. ignoring expenses and dividends), let's look at the year-by-year performance of such a strategy since 1972 based on the information provided in the Crawling Road blog post. This assumes a 25% split among all four asset classes and rebalancing at the end of each year. The worst asset class for a given year will be highlighted in Red (red font doesn't mean it's necessarily negative, just the worst performing), while the best performing asset class will be in Green. Down years overall will be highlighted in Red. For comparison purposes, the yearly Permanent Portfolio annual return through 2003 as reported by Harry Browne himself and the annual return of the commercially available PRPFX fund as reported in the prospectus (since 1997) will also be included for comparison purposes.
TSM = Total Stock Market Index
ST = Treasury 1-2 year Short Term Bonds
LT = Treasury 20+ year Long Term Bonds
Gold = Gold Bullion
Avg = Annual Return (includes interest and reinvested dividends)
HB = Annual Return as reported by Harry Browne (not available after 2003)
PRPFX = Annual Return of PRPFX fund (not available before 1997)
Annual Returns (%) of Different Investments (1972-2008)
| Year | TSM | ST | LT | Gold | Avg | HB | PRPFX |
|---|---|---|---|---|---|---|---|
| 1972 | 16.9 | 3.9 | 5.7 | 48.9 | 18.8 | 18.7 | N/A |
| 1973 | -18.1 | 6.1 | -1.1 | 75.6 | 15.6 | 10.6 | N/A |
| 1974 | -27.2 | 9.1 | 4.4 | 70.5 | 14.2 | 12.3 | N/A |
| 1975 | 38.7 | 7.9 | 9.2 | -22.7 | 8.3 | 3.7 | N/A |
| 1976 | 26.7 | 8.9 | 16.8 | -3.8 | 12.2 | 10.1 | N/A |
| 1977 | -4.2 | 3.7 | -0.7 | 23.5 | 5.6 | 5.2 | N/A |
| 1978 | 7.5 | 5.5 | -1.2 | 36.7 | 12.1 | 15.0 | N/A |
| 1979 | 23.0 | 10.4 | -1.2 | 136.3 | 42.1 | 36.7 | N/A |
| 1980 | 32.7 | 14.1 | -4.0 | 10.8 | 13.4 | 22.1 | N/A |
| 1981 | -3.7 | 18.9 | 1.9 | -32.8 | -3.9 | -6.2 | N/A |
| 1982 | 20.8 | 19.5 | 40.4 | 12.5 | 23.3 | 23.3 | N/A |
| 1983 | 22.0 | 8.6 | 0.7 | -14.3 | 4.2 | 4.3 | N/A |
| 1984 | 4.5 | 12.8 | 15.5 | -20.2 | 3.2 | 1.1 | N/A |
| 1985 | 32.2 | 13.2 | 31.0 | 6.9 | 20.8 | 20.1 | N/A |
| 1986 | 16.1 | 11.9 | 24.5 | 22.9 | 18.8 | 21.7 | N/A |
| 1987 | 1.7 | 6.0 | -2.9 | 20.2 | 6.2 | 5.3 | N/A |
| 1988 | 18.0 | 5.9 | 9.2 | -15.7 | 4.3 | 3.6 | N/A |
| 1989 | 28.9 | 8.7 | 17.9 | -1.7 | 13.5 | 14.8 | N/A |
| 1990 | -6.0 | 8.9 | 5.8 | -2.2 | 1.6 | -0.7 | N/A |
| 1991 | 34.7 | 10.7 | 17.4 | -10.4 | 13.1 | 11.5 | N/A |
| 1992 | 9.8 | 6.8 | 7.4 | -6.2 | 4.4 | 4.0 | N/A |
| 1993 | 10.6 | 6.4 | 16.8 | 17.7 | 12.9 | 12.6 | N/A |
| 1994 | -0.2 | -0.6 | -7.0 | -2.2 | -2.5 | -2.4 | N/A |
| 1995 | 35.8 | 12.1 | 30.1 | -5.9 | 18.0 | 16.6 | N/A |
| 1996 | 21.0 | 4.4 | -1.3 | -4.6 | 4.9 | 5.2 | N/A |
| 1997 | 31.0 | 6.4 | 13.9 | -21.5 | 7.5 | 6.7 | 6.7 |
| 1998 | 23.3 | 7.4 | 13.1 | -0.3 | 10.8 | 7.4 | -2.0 |
| 1999 | 23.8 | 1.9 | -8.7 | -0.2 | 4.2 | 4.7 | 3.3 |
| 2000 | -10.6 | 8.8 | 19.7 | -5.3 | 3.2 | 2.7 | 5.88 |
| 2001 | -11.0 | 7.8 | 4.3 | 2.4 | 0.9 | -1.0 | 3.81 |
| 2002 | -21.0 | 8.0 | 16.7 | 24.4 | 7.0 | 7.2 | 14.36 |
| 2003 | 31.4 | 2.4 | 2.7 | 19.6 | 14.0 | 11.8 | 20.45 |
| 2004 | 12.5 | 1.0 | 7.1 | 5.6 | 6.6 | N/A | 12.05 |
| 2005 | 6.0 | 1.8 | 6.6 | 18.1 | 8.1 | N/A | 7.62 |
| 2006 | 15.5 | 3.8 | 1.7 | 23.0 | 11.0 | N/A | 13.82 |
| 2007 | 5.5 | 5.9 | 9.2 | 30.9 | 12.9 | N/A | 12.43 |
| 2008 | -36.7 | 6.2 | 33.4 | 4.9 | 1.9 | N/A | -8.36 |
| Avg | 11.1 | 7.7 | 9.6 | 11.9 | 10.0 | 9.6 | 7.5 ('97-p) |
Sources: Crawling Road blog, HarryBrowne.org, The Permanent Portfolio Family and Funds Prospectus dated 6/1/2009
First, some observations about the above data. Just as Browne suggested, it's impossible to predict economic cycles from year-to-year and the asset class that outperformed one year, can just as easily be the worst performer the next. There is no discernible pattern as to which of the four categories will be best and worst in a given year and thus it is best to spread your assets amongst all the classes to reduce risk and volatility.
It is accepted that gold and stocks are the most volatile; in the 37 years of the analysis, gold performed the best or worst in 28 of them while stocks performed was the best or worst performer in 26 of them. Short-term and long-term bonds serve to moderate the volatility.
In the end, there were only two years of a negative return using this strategy (with the greatest single year loss in 1981 at -6.2% as reported by Harry Browne and -3.2% as reported by Crawling Road) as compared to ten years for the stock market (with the greatest loss of -36.7% in 2008). This strategy does seem to moderate risk as it performed well under all market conditions.
The Permanent Portfolio Strategy had a calculated Compound Annual Growth Rate (CAGR) of 9.79%, where the total stock market had a CAGR of 9.40% (i.e. virtually the same, but with greater risk and volatility). Finally, note that while the calculated average gain based on the 25/25/25/25 strategy and Browne's reported returns are quite similar, PRPFX certainly has somewhat varied results although they definitely mimic both strategies. Notably, the use of silver, swiss franc assets, and particular sectors of stocks (real estate, natural resource, and aggressive growth) probably make the number stray slightly from the others.
(Update: As of 11/23/2009, the Permanent Portfolio is up 13.21% YTD including capital gains, interests, and dividends. Gold is up about 31%, stocks are up 25%, short-term bonds are +0.2%, while long-term treasuries have sunk nearly 18%.)
Analysis
Now, let's look at a graphical representation of the Permanent Portfolio vs. the Total Stock Market over the course of this data (1972-2008).
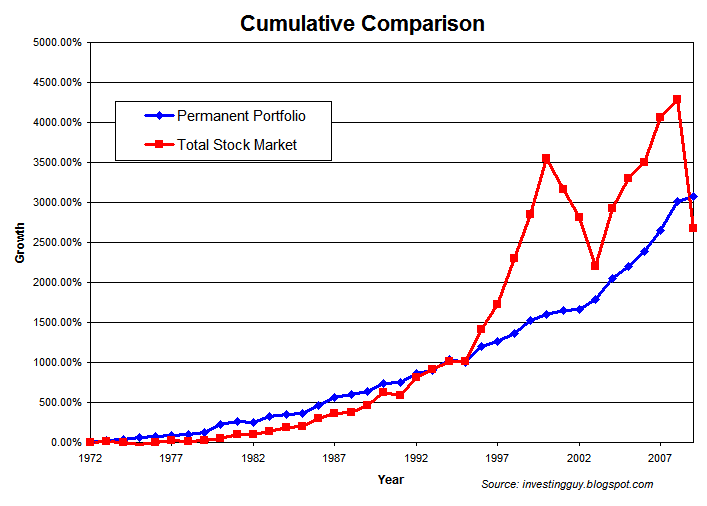
As you can see, they end up near the same percentage gain. From the start of 1972 to the end of 2008, the Permanent Portfolio strategy gained 3069%, while the Total Stock Market returned 2677%. Their CAGR's, again, are 9.79% and 9.40% respectively. Thought of another way, if you started with $10,000 in 1972, it would be worth $316,900 today using the Permanent Portfolio vs. $277,710 investing in the total stock market.
While they ended up in similar places, how they got there was quite different. You can see that from 1972 to 1995, there wasn't that grave of a difference (although certainly the stock market had more volatility as evidenced by the yearly annual returns in the graph printed below). However, starting in 1995, the stock market caught on fire as compared to the other classes and the total stock market severely outpeformed the Permanent Portfolio until 2000, when the market crashed again, and then outperformed it once more until 2008, when it crashed once more.
That is, the Permanent Portfolio performed reasonably well in all market conditions. It takes more of the "tortoise approach" in the tortoise and the hare analogy - it's slow, steady, and fairly reliable when compared to the antics of the stock market. It uses diversification in asset classes and economic conditions to increase purchasing power over time. The stock market, as the "hare," is more unpredictable and thus could severely outperform this strategy over the next 20 years. It could also underperform. There is no way to know. Even though these strategies ended up near the same point over this time period based on historical returns, there is no guarantee (in fact, it's probably unlikely) that they will perform similarly over the next 20 years. As they say, past results do not guarantee future returns.
Since gold was price controlled before 1971, it had a huge run-up from 1972 to 1974, so perhaps the starting point of this analysis is not fair. If we start in 1974, however, the end result is largely the same in that both perform similarly over the long-term (in this case, the stock market would have narrowly outperformed the Permanent Portfolio).
Let's also take a look at the year-to-year fluctuations of the Permanent Portfolio vs. the total stock market:

As already explained above, but more visually clear in the above graph, the stock market has much more volatility (and thus greater risk) than the permanent portfolio. As I said in my market timing post, market timing will always lag buy-and-hold during long-lasting bull markets. Similarly, it is clear that the permanent portfolio will lag the total stock market during periods of economic prosperity. But the point is that you don't know when or how long the economy will be in a recession, depression, prosperous cycle, deflationary, or inflationary period. Thus, according to Browne, you need to cover all your bases and be prepared for all possible scenarios.
Let's also take a look at the performance of the commercially available mutual fund, PRPFX (blue), vs. the S&P 500 (red) since its inception in 1996.
Permanent Portfolio Fund (PRPFX) vs. S&P 500

Source: Yahoo! Finance
As you can see, PRPFX has performed fairly well (hence its 5-star morningstar rating). We know that hot funds one day become cold the next, but this fund clearly has lower volatility than the stock market at large. During the huge bull market of 1996-2000, this fund did basically nothing and its percentage gains did not mimic the one's reported by the 25/25/25/25 strategy or Browne's website. Perhaps a new fund manager appeared or the strategy was modified at that point, as it seems the numbers more similarly mirror those of the espoused strategy from there on out.
During the bull market of 2000-2002, PRPFX was generally flat for the first half, but picked up major (positive) steam in 2002 when stocks plummeted. Overall, in its first six years, the fund was fairly stagnant with no major fluctuations, while the stock market had risen above a 120% gain only to fall to about the +75% level at the conclusion of 2002 (a 45% drop).
Since 2002, PRPFX has done very well. It mimicked the gains of the stock market during the 2002-2007 bull market, perhaps even outperforming the market. Then when the market starting declining at the end of 2007 and into early 2008, PRPFX continued to rise in price. Finally, when the market imploding at the end of 2008, PRPFX also took a hit, but not nearly as bad as the market as the other asset classes protected the fall and provided a hedge against the market.
As of September 2009, PRPFX is nearly at its highest point since its inception at nearly +110% since mid-1996, while the S&P 500 is hovering 65% below its 2000 and 2007 highs, although nearing +60% since mid-1996.
Conclusion
The Permanent Portfolio's conservative investing strategy was certainly all the rage during the 1980s when high inflation and poor market returns where the norm. In the 1990s, with stocks having one of the biggest run-ups in US history, this strategy perhaps returned to the backburner. Now that stocks have had paltry gains, if any, over the past decade, this strategy is perhaps coming to people's attention once again.
That isn't what Browne would want though - he'd want you to keep this portfolio in thick and thin because you cannot predict the future markets and economic cycles on the US and the world. This portfolio protects you against the downside by providing hedges against certain assets, while trying to capture the massive gains sometimes given by gold and stocks. It was intended to be for assets that you will need in life - such as retirement accounts. He suggested a separate portion of your portfolio can be more speculative, risky, and aggressive in nature - and named this the Variable Portfolio.
In conclusion, from the various performance results and back-testing, it does seem that the Permanent Portfolio holds up in poor economic times, while capturing many of the gains during prosperity. For those who want to have a more conservative strategy, instead of just increasing your bond percentage as most advisers would recommend, it might make sense to look into putting together a 25/25/25/25 strategy or invest in PRPFX with the portion of your assets that you cannot deal with declining significantly in value. For the majority of individuals, I don't recommend this strategy as gold is a speculative commodity that pays no dividends and doesn't have any real expected gain (unlike stocks that pay dividends and grow over time) and a full 75% of the portfolio is essentially a hedging strategy against economic prosperity (an excessive amount of cash, LT bonds, and gold, in my opinion). Having said that, I do like the idea of stable portfolio that does not attempt to time the market or economic cycles and is able to increase purchasing power over time much more significantly than money market funds.
With this strategy having such success the past ten years (namely due to the poor returns in stock and gold reaching an all-time high), this strategy is back in vogue. Investors should be careful not to chase performance and past results are no guarantee of the future. For certain individuals, it might make sense to explore employing certain facets of the permanent portfolio for a portion of one's overall portfolio; however, in general, I still think a well-diversified, age and risk-specific tolerance allocation of stocks and bonds through low-cost index funds is the way to go for the overwhelming majority of the population.