I was surfing the web and came across Jason Zweig's personal website, which has a wealth of interesting articles and insights. Zweig, a finance columnist for The Wall Street Journal, former senior writer for Money magazine, and the editor who added extensive commentary following each chapter in the 2003 revised version of Benjamin Graham's The Intelligent Investor, is definitely one of the "good guys" in the finance and personal investing world. He subscribes to the low-cost indexing approach that is far too uncommon among financial commentators these days.
In any event, I came across his article "Get Smart About Sectors," published in December 2002 in Money. At first glance, this seems like a very un-Zweig-like article. Sector investing? Doesn't that increase risk and reduce diversification? Well, yeah, if you're simply investing in a sector because you think it's "hot" and your motivation is simply to optimize returns. Rather, Zweig's article proposes another motivating factor behind sector investing - to serve as a hedge against human capital. That is, your job. Particularly if you work in a high-risk industry, you may want to think about balancing that risk with your financial capital in a sector that correlates the least with your human capital. This is the basic tenet behind diversification; and Zweig argues that this strategy will help reduce risk and increase diversification.
I have heard of this strategy in passing, but hadn't come across a detailed article such as Zweig's until now (despite the fact that it was published in 2002!). This premise certainly makes sense. Just ask those at Enron who loaded up on company stock (as a sidenote, I recommend keeping your company's stock holding as less than 5% of your net worth if at all possible). On page 2, you can consult a chart of the various sectors and which sector correlates the least with it. For example, if you work in mining, you might consider having a position in a utilities sector fund since it has the lowest correlation at -17. Zweig does not encourage moving into and out of sectors in an attempt to time the market's movements. Rather, he encourages a buy-and-hold long-term approach just as he does with typical index funds.
Zweig comments that the average sector fund charges 1.74%. That "average" is an absurd fee and can be easily avoided. Perhaps they didn't exist at the time of the article, but you can gain access to any of these sectors through Select Sector SPDRs. They have an expense ratio of about 0.22% - a far cry from the 1.74% average. Another alternative if you don't want to go to the ETF route, is to use the Fidelity Select Funds, which are actively managed and charge about 1.0%, but only have a $2,500 minimum. (You must hold these for 30-days or will be charged a redemption fee.) Vanguard also has several sector specific funds and ETFs that are in the 0.25%-0.38% range, but some require a minimum investment of $25,000 and charge a redemption fee of 1% if held for less than one year. But, again, you're planning to hold it more than one year anyways, right? Consult each individual prospectus or fund page for details. Some are actively managed, while others are simply indexes. For example, here is one of the Energy funds.
Just remember, it is not advisable to attempt to use sector investing as a means to outperform the market and move into and out of hot sectors every two months. (Although I did explore a sector rotation investing strategy in a post here. The conclusion basically was that any outperformance one experiences due to sector rotation can be attributed to higher risk and volatility. While during certain periods this strategy did outperform, there were other periods of significant underperformance. Volatility overall was much greater than simply holding the total market.)
In the end, the idea that sector funds can be used as a hedge against potential job loss and serve to further diversify your portfolio is an interesting one. I don't think this strategy is imperative for everybody to use by any means, but if you're in a particularly high-risk industry or have concerns about job security or pay raises, this strategy might be one to consider.
Update: There is a timely article that's worth a read about the importance of human capital and its relevance to risk-taking in one's investments in today's Wall Street Journal. The article, "How to Think Smarter About Risk," is written by Mosche Milevsky, an Associate Professor of Fianance at York University in Canada. While he doesn't talk about sector investing, he introduces the concept of "personal beta," advising individuals to consider how a drop in the stock market would affect their paycheck and how such risks should be considered when devising a portfolio. If you're an investment banker your earnings are more tied to the stock market and you may want to take fewer risks with the rest of your portfolio. On the other hand, if you're a nurse or tenured professor such market movements have little relevance and you may want to be more aggressive and in stocks with your financial capital. Interesting read!

Tips, Analysis, and Ramblings About Individual Investing and Personal Finance
Fama And French Three Factor Model and the Small Value Premium

Capital Asset Pricing Model (CAPM)
Before going into details of the Three Factor Model, it's first important to have a brief understanding of the Capital Asset Pricing Model (CAPM) on which the Three Factor is largely based. CAPM basically only uses market risk (systemic and non-systemic) as a proxy for expected return. Its equation is Ra = Rf + Ba(Rm - Rf), where Rf is the risk free rate of return, Ba is the beta of the security, and Rm is the expected market return. Essentially, as explained by this equation, investors are compensated by risk as measured by beta and time value. As investopedia explains:
Eugene Fama, a professor at Booth, and Kenneth French , a professor at Tuck, developed a model by which to further describe market behavior, expanding on the CAPM. They published their findings in the Journal of Finance in 1992 ("The Cross-Section of Expected Stock Returns") and provided more details a year later in the Journal of Financial Economics ("Common Risk Factors in the Returns on Stocks and Bonds"). While CAPM uses the single factor of beta to compare returns, Fama and French found that to be too simplistic of an approach and added both size and value as factors to the model. They found that historically stocks with high book-to-market ratios (i.e. value stocks) and small-cap stocks have performed better than the market at large. Thus, they simply added to the end of the CAPM equation expressions SMB ("small (market capitalization) minus big"), HML ("high (book-to-price ratio) minus low"), and alpha. This new equation accounts for the tendency of outperformance of these two factors and gives a better comparison tool for evaluating fund performance, among other uses.
The important part of their findings to us as individual investors and the main take home message is value stocks tend to perform better than growth stocks and small caps typically outperform large cap companies. Thus, portfolios with a high percentage of small cap and value would result in a lower value using this model than the CAPM, since it adjusts downward on those two accords.

Here is another chart from Index Funds Advisors, showing the growth of $1 from 1928 to 2007. The annualized return is on the y-axis while risk in the form of standard deviation is on the x-axis. Small-value experienced a 14.6% annualized return (albeit with higher risk) while large-growth had a 9.6% annualized return through December 2004. One interesting datapoint on this chart is small-growth, which has historically had relatively weak returns with a high standard deviation.
Small-Value Premium
Not only do small-cap and value plays have higher expected return, but they also provide additional diversification. While one may think that simply "owning the entire market" is as diversified as one can get in US equities, the weighting mechanism that indices use is "a far different outcome from what one would expect," explains Larry Swedrow in What Wall Street Doesn't Want You to Know. "Almost 70% of the portfolio is large-cap growth stocks." He recommends putting a large percentage of the portfolio in small-cap or value funds to compensate for this perhaps seemingly bizarre weighting. When your large-cap growth zigs, your small-cap or value holdings may zag, enabling you to sustain performance even in bearish times. Of course, these asset classes aren't perfectly negatively correlated so it's not going to be a flawless zig/zag relationship (nothing is unless you're shorting and long in the same position, which would be pretty pointless), but at least it presumably provides protection against the downside while at the same time increasing your expected return. A double win!
As stated above with the Fama French Model, but it doesn't hurt to emphasize this point, since small-caps and value typically carry larger risks, the expected return must be greater to compensate. This is the small-value premium that people seek.
What this means for your portfolio
Personally, I think it makes the most sense for individual investors to simply hold small-cap value and ignore small-blend and large value. I find this simplified approach meets the desired results and is easier to hold and maintain in a tax efficient manner. Some aggressive investors prefer a 50/50 split between total stock and small-value. I personally like approximately a 2:1 total stock to small value ratio. Value, small-cap, and small-cap value funds are typically less tax efficient than a total stock market fund counterpart, so it probably makes sense to hold the small-cap value in retirement accounts. Although examining the tax cost ratio via Morningstar of a fund like VISVX (Vanguard Small-Cap Value Index) shows the difference is negligible (in fact, VISVX seems to be more tax efficient than VTSMX over certain periods) , so holding it in taxable account certainly isn't the worst thing you could do.
Remember the media calling 2000-2010 the "lost decade" as the S&P was virtually unchanged? Well, if you had invested a considerable sum in small-cap value, your portfolio would be in seriously positive territory for that period. Not so lost anymore! From January 14, 2000 to June 10, 2010 (today), Vanguard Total Stock Market is down nearly 17%. It certainly would seem like a waste of investments if that was your return after 10 whole years. VISVX, on the other hand, is up 64% over the same period - an outperformance of 81%! And you thought those timing strategies had good outperformance. This strategy simply calls for setting a slightly different asset allocation and letting it be (which is much more tax efficient) and absolutely obliterated more complicated, tax-inefficient strategies.
Let's take a look at the growth of $10,000 chart of Total Stock Market and Small-Cap Value since June 1998. The blue line is total stock, while the orange line is small value.

As you can see, from 1998 to mid-2000, the total stock market largely outpeformed small-cap value as tech growth stocks were all the rage and escalated in value like no other time in history. When the tech bubble burst in 2000, though, you'd certainly be glad you had small-cap value to provide diversification and to offset some risk. In the 2000 to January 2003 period, the total stock market plummeted 36%, while small-cap value enjoyed a small (but real) 4% gain. That is the zig/zag action we were talking about earlier. The 1998-2003 timeframe illustrates this diversification benefit perfectly. While the total stock market took you on a roller coaster ride (where your $10,000 grew to $13,000 before falling to $8,000), small-cap value had a different trajectory and would have somewhat abated that volatility (for both the upside and downside).
In the end, after twelve years your $10,000 invested in VTSMX grew to nearly $12,000, while small-cap value blossomed to nearly $19,500. That's the small-cap premium we're looking for!
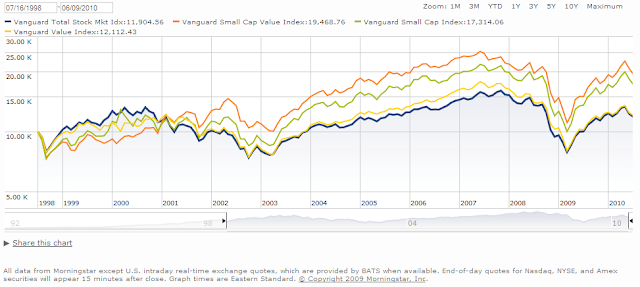
Just as a comparision, here is a chart comparing total stock (blue) with value (yellow), small blend (green), and small-value (orange). As you can see (although this won't always be the case), small-value really provides the best of both worlds in the Fama French model.
This strategy should be in the arsenal of all indexing individual investors. Small-cap value provides greater expected return and increased diversification with the caveat that one should expect slightly more volatility and risk.
Edit: DIY Investor brought up a good point in the comments that investors with lower risk tolerances (e.g. retirees) might want to think twice before "loading up" on these asset classes based on the downside risk, standard deviation, and volatility measures. I certainly agree and probably should have mentioned this above as there is certainly is increased risk in these asset classes. However, as I responded, I think investors are more than amply compensated for the additional risk. A retiree with a 40/60 equities/bonds portfolio might have something like 20% Total US, 10% Foreign, and 10% US Small Value based on my proposed 2:1 US Total to small value. 10% Small-Value, even with its volatility, is not going to wreak havoc on that portfolio and would marginally increase your risk (while correspondingly increasing your expected return). Looking at the alpha measures of VISVX (quite simply, a risk-adjusted measure of performance; of course, past performance doesn't guarantee future results), VISVX has a 3-year alpha of 6.68 (with a beta of 1.28) and a 1-year alpha of 6.68. That is, VISVX has enjoyed nearly a 7% outperformance (annually) of what CAPM would predict (i.e. after taking risk/beta/volatility into account). VTSMX, for comparison has an alpha of 1.18 (and beta of 1.03, as expected). As stated, this doesn't guarantee anything for the future, but historically the alpha values for small-value are favorable and investors have been more than compensated for the increased risk. But, it is important to stress, that the increased risk is real, so you should take this into account if you plan to dip in this asset class.
Update 6/16/10: Larry Swedroe's recent article on why the Small Growth Index is the "Black Hole of Investing." That's why I avoid it all together.
The CAPM says that the expected return of a security or a portfolio equals the rate on a risk-free security plus a risk premium. If this expected return does not meet or beat the required return, then the investment should not be undertaken. The security market line plots the results of the CAPM for all different risks (betas).Fama and French Three Factor Model
Eugene Fama, a professor at Booth, and Kenneth French , a professor at Tuck, developed a model by which to further describe market behavior, expanding on the CAPM. They published their findings in the Journal of Finance in 1992 ("The Cross-Section of Expected Stock Returns") and provided more details a year later in the Journal of Financial Economics ("Common Risk Factors in the Returns on Stocks and Bonds"). While CAPM uses the single factor of beta to compare returns, Fama and French found that to be too simplistic of an approach and added both size and value as factors to the model. They found that historically stocks with high book-to-market ratios (i.e. value stocks) and small-cap stocks have performed better than the market at large. Thus, they simply added to the end of the CAPM equation expressions SMB ("small (market capitalization) minus big"), HML ("high (book-to-price ratio) minus low"), and alpha. This new equation accounts for the tendency of outperformance of these two factors and gives a better comparison tool for evaluating fund performance, among other uses.
The important part of their findings to us as individual investors and the main take home message is value stocks tend to perform better than growth stocks and small caps typically outperform large cap companies. Thus, portfolios with a high percentage of small cap and value would result in a lower value using this model than the CAPM, since it adjusts downward on those two accords.

(click to enlarge)
As you can see from the above chart courtesy of the New York Times (who used Fama and French's data), since 1926 small-cap value companies have hugely outperformed large-cap growth firms. Note that this is on a logarithmic scale and not linear, so the outperformance doesn't look as dramatic as it could. But this is a nearly a 100-fold (or 10,000%) difference!Here is another chart from Index Funds Advisors, showing the growth of $1 from 1928 to 2007. The annualized return is on the y-axis while risk in the form of standard deviation is on the x-axis. Small-value experienced a 14.6% annualized return (albeit with higher risk) while large-growth had a 9.6% annualized return through December 2004. One interesting datapoint on this chart is small-growth, which has historically had relatively weak returns with a high standard deviation.
(click to enlarge)
 Source: Index Funds Advisors

Small-Value Premium
Not only do small-cap and value plays have higher expected return, but they also provide additional diversification. While one may think that simply "owning the entire market" is as diversified as one can get in US equities, the weighting mechanism that indices use is "a far different outcome from what one would expect," explains Larry Swedrow in What Wall Street Doesn't Want You to Know. "Almost 70% of the portfolio is large-cap growth stocks." He recommends putting a large percentage of the portfolio in small-cap or value funds to compensate for this perhaps seemingly bizarre weighting. When your large-cap growth zigs, your small-cap or value holdings may zag, enabling you to sustain performance even in bearish times. Of course, these asset classes aren't perfectly negatively correlated so it's not going to be a flawless zig/zag relationship (nothing is unless you're shorting and long in the same position, which would be pretty pointless), but at least it presumably provides protection against the downside while at the same time increasing your expected return. A double win!
As stated above with the Fama French Model, but it doesn't hurt to emphasize this point, since small-caps and value typically carry larger risks, the expected return must be greater to compensate. This is the small-value premium that people seek.
What this means for your portfolio
Personally, I think it makes the most sense for individual investors to simply hold small-cap value and ignore small-blend and large value. I find this simplified approach meets the desired results and is easier to hold and maintain in a tax efficient manner. Some aggressive investors prefer a 50/50 split between total stock and small-value. I personally like approximately a 2:1 total stock to small value ratio. Value, small-cap, and small-cap value funds are typically less tax efficient than a total stock market fund counterpart, so it probably makes sense to hold the small-cap value in retirement accounts. Although examining the tax cost ratio via Morningstar of a fund like VISVX (Vanguard Small-Cap Value Index) shows the difference is negligible (in fact, VISVX seems to be more tax efficient than VTSMX over certain periods) , so holding it in taxable account certainly isn't the worst thing you could do.
Remember the media calling 2000-2010 the "lost decade" as the S&P was virtually unchanged? Well, if you had invested a considerable sum in small-cap value, your portfolio would be in seriously positive territory for that period. Not so lost anymore! From January 14, 2000 to June 10, 2010 (today), Vanguard Total Stock Market is down nearly 17%. It certainly would seem like a waste of investments if that was your return after 10 whole years. VISVX, on the other hand, is up 64% over the same period - an outperformance of 81%! And you thought those timing strategies had good outperformance. This strategy simply calls for setting a slightly different asset allocation and letting it be (which is much more tax efficient) and absolutely obliterated more complicated, tax-inefficient strategies.
Let's take a look at the growth of $10,000 chart of Total Stock Market and Small-Cap Value since June 1998. The blue line is total stock, while the orange line is small value.

(Source: Morningstar Inc.)
In the end, after twelve years your $10,000 invested in VTSMX grew to nearly $12,000, while small-cap value blossomed to nearly $19,500. That's the small-cap premium we're looking for!
Just as a comparision, here is a chart comparing total stock (blue) with value (yellow), small blend (green), and small-value (orange). As you can see (although this won't always be the case), small-value really provides the best of both worlds in the Fama French model.

(Source: Morningstar Inc.)
The Value Index largely mirrored total stock (although provided some refuge during the growth uprun and demolition from 1998-2003), while small-blend provided more diversification, and small-value gave even a larger return due to its premium.This strategy should be in the arsenal of all indexing individual investors. Small-cap value provides greater expected return and increased diversification with the caveat that one should expect slightly more volatility and risk.
Edit: DIY Investor brought up a good point in the comments that investors with lower risk tolerances (e.g. retirees) might want to think twice before "loading up" on these asset classes based on the downside risk, standard deviation, and volatility measures. I certainly agree and probably should have mentioned this above as there is certainly is increased risk in these asset classes. However, as I responded, I think investors are more than amply compensated for the additional risk. A retiree with a 40/60 equities/bonds portfolio might have something like 20% Total US, 10% Foreign, and 10% US Small Value based on my proposed 2:1 US Total to small value. 10% Small-Value, even with its volatility, is not going to wreak havoc on that portfolio and would marginally increase your risk (while correspondingly increasing your expected return). Looking at the alpha measures of VISVX (quite simply, a risk-adjusted measure of performance; of course, past performance doesn't guarantee future results), VISVX has a 3-year alpha of 6.68 (with a beta of 1.28) and a 1-year alpha of 6.68. That is, VISVX has enjoyed nearly a 7% outperformance (annually) of what CAPM would predict (i.e. after taking risk/beta/volatility into account). VTSMX, for comparison has an alpha of 1.18 (and beta of 1.03, as expected). As stated, this doesn't guarantee anything for the future, but historically the alpha values for small-value are favorable and investors have been more than compensated for the increased risk. But, it is important to stress, that the increased risk is real, so you should take this into account if you plan to dip in this asset class.
Update 6/16/10: Larry Swedroe's recent article on why the Small Growth Index is the "Black Hole of Investing." That's why I avoid it all together.

Market goes nuts - VTI down 33%, recovers 29% in a matter of a few minutes
Wild ride on the market today. (Still ongoing.) VTI (Vanguard Total Stock Market ETF) was down 33% at one point, and then in a matter of a few minutes recovered nearly 29%. (Note that this was not how much the actual stocks in the ETF went down as ETFs are priced by the highest bidder; many ETFs suffered presumably from liquidity issues. Hence, my title is a bit misleading.) The Dow sunk nearly 1000 points, or 9.8%, and quickly shot back up 600 points. Heck, VB (Vanguard Small Cap ETF) was down 96% at one point (to 0.1; the bid price that is, the ask was still somewhat normal so purchasing at that price wouldn't have gone through) and then quickly shot back up. Some people made a whole lot of money today, while others lost a bundle.
I can't even load the Yahoo! Finance webpage. Apparently, several people are unable to access their brokerage accounts.
Get this: it appears that an order went through for 39,000 shares of VTI for around $39! VTI is now at 57.6. That computer made somebody a lot of money.
More to come....
Update 4:05 PM ET: CNBC is reporting that the crash was caused by a trading error at Citigroup. Earlier reported simply to be a "major firm."
Update 7:30 PM ET: It appears that there was a technical glitch in a variety of stocks, including P&G. Nasdaq and NYSE are canceling all trades that moved more than 60%. So, any of those VB trades at ridiculously low prices are canceled; however, the VTI trade @ 39 will stand as it's within 60%.
Update 5/7/10: It seems as if the "fat fingers" theory blamed on Citigroup was pre-mature, and there is no evidence to substantiate it.
I can't even load the Yahoo! Finance webpage. Apparently, several people are unable to access their brokerage accounts.
Get this: it appears that an order went through for 39,000 shares of VTI for around $39! VTI is now at 57.6. That computer made somebody a lot of money.
More to come....
Update 4:05 PM ET: CNBC is reporting that the crash was caused by a trading error at Citigroup. Earlier reported simply to be a "major firm."
Update 7:30 PM ET: It appears that there was a technical glitch in a variety of stocks, including P&G. Nasdaq and NYSE are canceling all trades that moved more than 60%. So, any of those VB trades at ridiculously low prices are canceled; however, the VTI trade @ 39 will stand as it's within 60%.
Update 5/7/10: It seems as if the "fat fingers" theory blamed on Citigroup was pre-mature, and there is no evidence to substantiate it.
Vanguard Joins the Price War! Free VG ETF Trades and Cheap Equity Commissions
Wow! That is all I can say about the latest development. Vanguard just announced that its brokerage clients can now trade their entire 46 low-cost ETFs commission free! On top of that, they majorly slashed their equity commissions, which used to not be competitive with the rest of the market. Most commissions will be $7 or $2.
Here are the details:
New commission rates for ETFs and stocks
| Assets invested in Vanguard funds and ETFs _________________ | Commissions for Vanguard ETF transactions _________________ | Commissions for equity transactions _______________ |
|---|---|---|
| Less than $50,000 (standard rate) | Free | $7 for the first 25 (subsequent trades $20) |
| $50,000–$500,000 (Voyager®) | Free | $7 |
| $500,000–$1 million (Voyager Select®) | Free | $2 |
| $1 million or more (Flagship®) | Free | First 25 free (subsequent trades $2) |
Taken from https://personal.vanguard.com/us/insights/article/commissions-05042010
Vanguard CEO Bill McNabb explained:
For 35 years, Vanguard has been committed to reducing the cost of investing in mutual funds for our clients. Now, Vanguard is expanding our low-cost commitment to ETFs. Importantly, Vanguard offers a greater choice of ETFs with expense ratios that are among the lowest in the industry.
This Money article has more information and quotes. Yet again I need to update my Vanguard, Schwab, and Fidelity comparison post. This action is clearly in response to Schwab's and Fidelity's prior unveilings and it's great to see Vanguard attempt to remain competitive in all facets. Great news all around!
Note that there a few fine print issues that are important to note. First of all, it appears that the $50 fee for ETF conversion has been eliminated. Also note that "if you buy and sell the same Vanguard ETF in a Vanguard Brokerage account more than 25 times in a 12-month period, you may be restricted from purchasing that Vanguard ETF through your Vanguard Brokerage account for 60 days." Lastly, it appears that there is still a 1% redemption fee of up to $250 for selling non-Vanguard No-Transaction Fee funds held less than 180 days.
Update: DIY Investor brought up a good point in the comments section that I thought I'd add to this post. The free commissions may lead certain investors to increase their trading frequency tremendously, which, according to various behavioral economics studies, has proven to be overwhelmingly unsuccessful. McNabb addresses this point, further emphasizing Vanguard's underlying Jack Bogle approach to investing for the long-term:
Update: DIY Investor brought up a good point in the comments section that I thought I'd add to this post. The free commissions may lead certain investors to increase their trading frequency tremendously, which, according to various behavioral economics studies, has proven to be overwhelmingly unsuccessful. McNabb addresses this point, further emphasizing Vanguard's underlying Jack Bogle approach to investing for the long-term:
To be clear, our commission-free offer is not intended to encourage the active trading of ETFs, which we believe is counterproductive and rarely successful.Of course, that warning certainly won't convince all individuals. At least, Vanguard does have in the fine print that they reserve the right to restrict ETF purchases for those actively trading them above a certain threshold. This leads us to the one major concern of this announcement for investors that are disciplined, dollar-cost average indexers - since these transactions certainly do cost money and Vanguard is an "at-cost" provider, are they going to have to increase the expense ratios of their funds to compensate for those that excessively trade? Well, one could argue that the increased assets that will be poured in as a result will help to reduce costs and the economies of scales of the ETFs will reduce spreads and increase liquidity, making Vanguard ETFs even better. Rick Ferri, CFA, as quoted in the above linked article, suggests that Vanguard's patented structure of mutual funds/ETFs will make this commission free trading advantageous to Vanguard mutual fund holders as well. In any event, there certainly are a couple reasons for caution that will be interesting to monitor, but, in the end, I still see this as a very positive development for Vanguard customers.
Judge Rules Against Schwab in YieldPlus Fund Case
Last week a judge ruled that Charles Schwab (NYSE: SCHW) violated the law with its YieldPlus Mutual Fund (SWYSX) when it held upwards of 50% mortgage-backed securities without shareholder approval. (See "Angry Schwab bond-fund customers win in court" and "Judge Rules Charles Schwab Violated Law in YieldPlus Mutual-Fund Case.") This case, somewhat surprisingly, has not been publicized much. With the fund seeking to increase its appeal to the masses, its managers loaded up on risky mortgage-related structured debt to increase its yield, and consequently its assets ballooned to $13 billion in 2007. In other words, the strategy worked. The collapse of the mortgage market in 2008, however, led the fund to lose a whopping 36% of its value, a far cry from the advertised description of the fund as a low-risk alternative to money market and cash accounts. The fund is currently described as seeking "high current income with minimal changes in share price." This lawsuit reminds me of the one filed against Schwab's total bond fund for the same reason, which I reported in my Lazy Portfolios post.
In 2001, Schwab apparently stated that the fund would hold a maximum of 25% of its assets in any one particular industry, but amended it in 2006 stating that its fund managers reserved the right to make investment decisions at its own discretion without shareholder approval. The judge ruled that this went against the Investment Company Act of 1940 that states that once a mutual fund proposes a policy (as Schwab did in 2001), it can only modify the asset allocations after an okay from the majority of the shareholders. While Schwab publicly disclosed its holdings at all times and was transparent in its investments (this certainly wasn't a hedge fund-like case wherein the fund was not clear with its investments), it neglected to seek approval from its investors when changing investment philosophy in an attempt to increase the funds yield and attract additional monies.
Lead attorney for the plaintiff, Steve Berman, explained:
Plaintiffs contend that Schwab wanted complete, unfettered control of the fund so the managers could drive up yields, to in turn attract more investors as YieldPlus grew into the largest ultra-short fund in the country. Schwab's money managers did, indeed, jump in and gamble, but with other people's money.
This case does not signal to me that Schwab has a wider corporate issue and that you should no longer trust them with your money. Personally, I think Schwab has some really great low-cost offerings and is a customer-friendly discount brokerage with ample resources and insightful research reports. In this isolated incident, though, specific fund managers made a particularly egregious judgment in an effort to get more investors into the fund. This could have easily happened at a variety of different mutual fund families and I still trust Schwab as much as I would any other highly-respected brokerage firm.
There are two important lessons to learn from this debacle, though. First, monitor your investments regularly and look closely at the holdings of every fund you own to ensure that it meets your standards and risk tolerance. In this case, simply reading the prospectus or using a fund analyzer tool online for the YieldPlus fund would indicate to any investor that it held greater than 50% of its holdings in privatized mortgage-backed securities. That would be a red flag to any educated investor as this clearly is at odds with the funds intended risk/reward profile. Schwab did not try to cover this up and the managers disclosed the funds holdings at regular intervals as required by the SEC. On the other hand, their general description of the fund was misleading and thus, as an investor, you should learn to delve deeper by reading the prospectus and holdings in detail. This applies to all sorts of funds, especially "closet-index funds" - that is, actively managed funds that charge you a hefty expense ratio, but when you breakdown the holdings, it is essentially tied to an index benchmark and could be held in a more cost effective manner. The second lesson from this case is that you must resist the urge to chase yield. Money managers knew that loading up on MBSs would help sell the fund as the yield surged, but this certainly backfired. Legendary Vanguard founder Jack Bogle explained that this was a classic example of a firm "reaching for yield" to attract new investors, and a typical action many mutual fund companies cannot resist. "The message over and over again," Bogle says, "is, 'Go the straight and narrow.'"
The amount of damages will be determined in a trial beginning May 10.
Update 4/20/10: Schwab has decided to settle for $200 million rather than go to trial. Schwab's statement indicated that settling "allows the company to avoid the distraction and uncertainty of a trial, and the further possibility of a protracted appeals process." They admit no liability under the settlement, which is still awaiting final court approval.
Subscribe to:
Posts (Atom)
